


Geoinformatics Solutions for Integrated Agro-ecosystems Research
GIS Data
Maps in: North Africa and West Asia

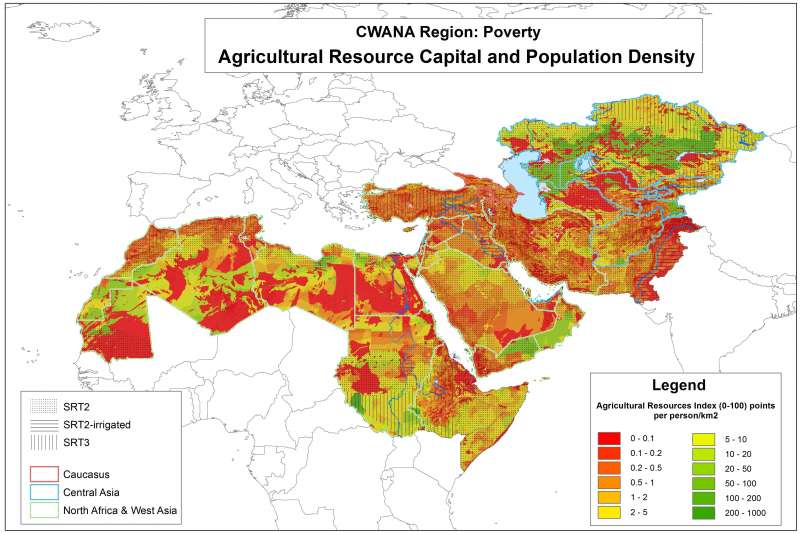
Agricultural Resource Capital and Population Density
A high-potential agricultural resource base can be insufficient for a large rural population, whereas areas with lower potential for agriculture but also lower population densities can be sustainable. This map links agricultural resource poverty to population density.
Metadataclose[x]
Agricultural Resource Capital and Population Density
A high-potential agricultural resource base can be insufficient for a large rural population, whereas areas with lower potential for agriculture but also lower population densities can be sustainable. This map links agricultural resource poverty to population density.

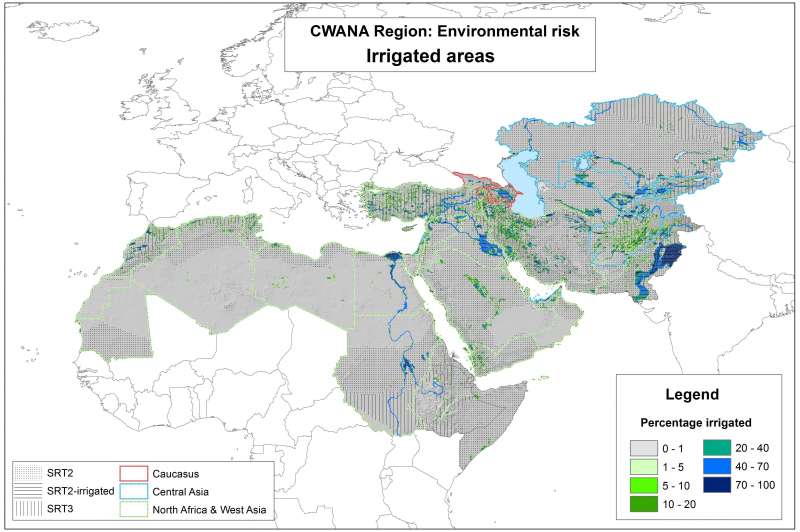
Irrigated areas
This map shows the percentage of land that is irrigated. Whereas irrigation is the ultimate solution for agricultural water shortage, this map makes clear that only a small fraction of the drylands is irrigated, although there are major differences between individual countries (-> Statistical Tables).
Metadataclose[x]
Irrigated areas
This map shows the percentage of land that is irrigated. Whereas irrigation is the ultimate solution for agricultural water shortage, this map makes clear that only a small fraction of the drylands is irrigated, although there are major differences between individual countries (-> Statistical Tables).

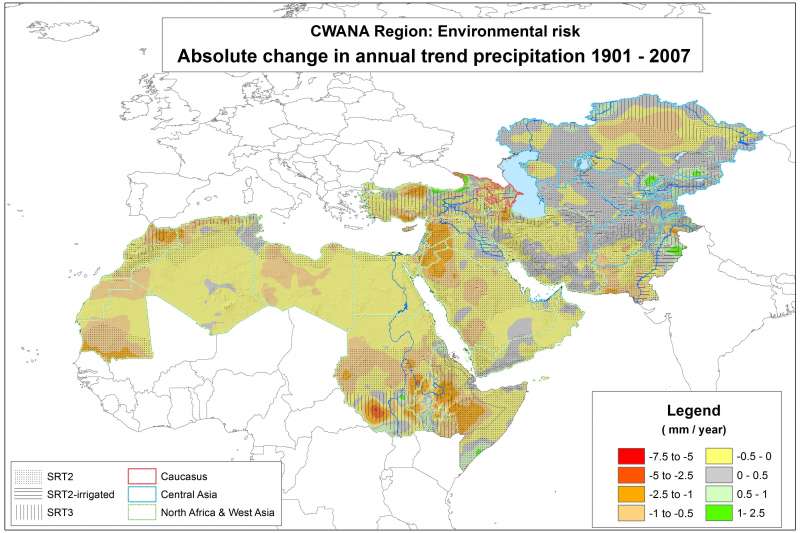
Absolute change in annual trend precipitation 1901-2007
This map is based on the Full Data Reanalysis Product Version 4 of the Global Precipitation Climatology Centre (GPCC). It has been obtained by linear regression fitted to the 107-year time series of annual precipitation of each 0.5x0.5 degree grid cell by the least-squares method and subsequent resampling to 0.008333 degree (about 1 km) spatial resolution. The map shows the average absolute change in mm/year as measured along the trend line between 1901 and 2007. With some exceptions (e.g. parts of the Black Sea coast and the rim of Central Asia mountains) the trend is negative in most of the region.
Metadataclose[x]
Absolute change in annual trend precipitation 1901-2007
This map is based on the Full Data Reanalysis Product Version 4 of the Global Precipitation Climatology Centre (GPCC). It has been obtained by linear regression fitted to the 107-year time series of annual precipitation of each 0.5x0.5 degree grid cell by the least-squares method and subsequent resampling to 0.008333 degree (about 1 km) spatial resolution. The map shows the average absolute change in mm/year as measured along the trend line between 1901 and 2007. With some exceptions (e.g. parts of the Black Sea coast and the rim of Central Asia mountains) the trend is negative in most of the region.
")
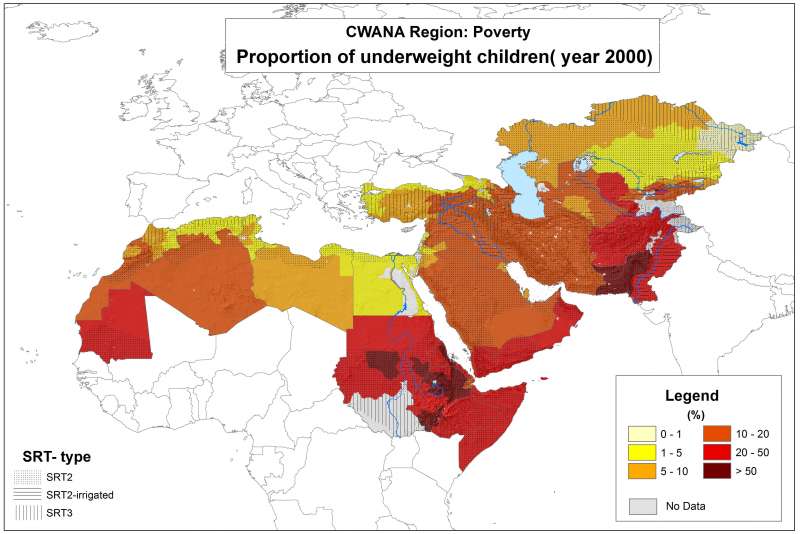
Proportion of underweight children(year 2000)
This map shows the percentage of underweight children. As with the map of population density , the uneven pattern of large and small polygons is an artifact due to differences in the size of the statistical units available in different countries and, while offering a reasonable average, does not necessarily allow a point-exact estimate of this poverty indicator.
Metadataclose[x]
Proportion of underweight children(year 2000)
This map shows the percentage of underweight children. As with the map of population density , the uneven pattern of large and small polygons is an artifact due to differences in the size of the statistical units available in different countries and, while offering a reasonable average, does not necessarily allow a point-exact estimate of this poverty indicator.

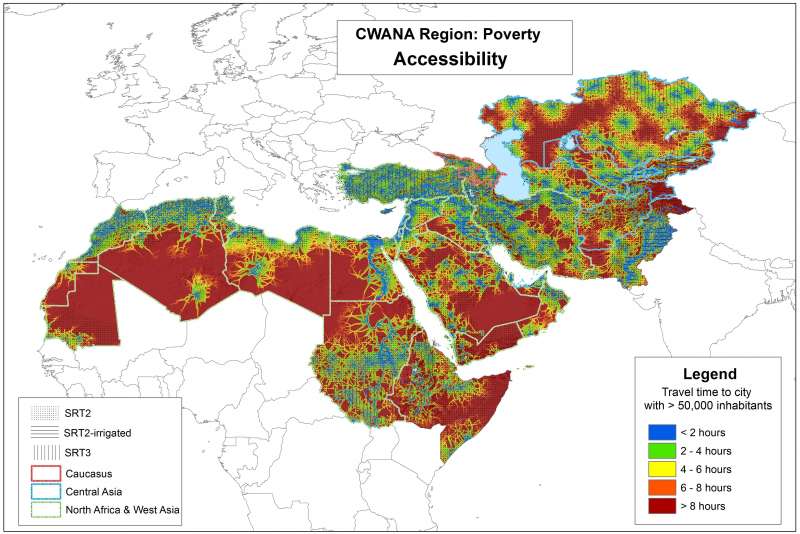
Accessibility to markets
This map shows travel time to cities with at least 50,000 inhabitants as an indicator of accessibility to markets.
Metadataclose[x]
Accessibility to markets
This map shows travel time to cities with at least 50,000 inhabitants as an indicator of accessibility to markets.