


Geoinformatics Solutions for Integrated Agro-ecosystems Research
GIS Data
Maps in: Central Asia

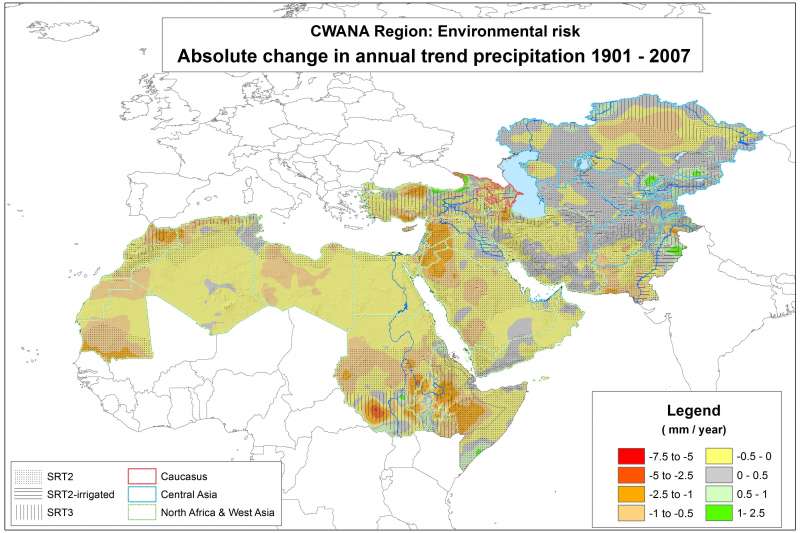
Absolute change in annual trend precipitation 1901-2007
This map is based on the Full Data Reanalysis Product Version 4 of the Global Precipitation Climatology Centre (GPCC). It has been obtained by linear regression fitted to the 107-year time series of annual precipitation of each 0.5x0.5 degree grid cell by the least-squares method and subsequent resampling to 0.008333 degree (about 1 km) spatial resolution. The map shows the average absolute change in mm/year as measured along the trend line between 1901 and 2007. With some exceptions (e.g. parts of the Black Sea coast and the rim of Central Asia mountains) the trend is negative in most of the region.
Metadataclose[x]
Absolute change in annual trend precipitation 1901-2007
This map is based on the Full Data Reanalysis Product Version 4 of the Global Precipitation Climatology Centre (GPCC). It has been obtained by linear regression fitted to the 107-year time series of annual precipitation of each 0.5x0.5 degree grid cell by the least-squares method and subsequent resampling to 0.008333 degree (about 1 km) spatial resolution. The map shows the average absolute change in mm/year as measured along the trend line between 1901 and 2007. With some exceptions (e.g. parts of the Black Sea coast and the rim of Central Asia mountains) the trend is negative in most of the region.

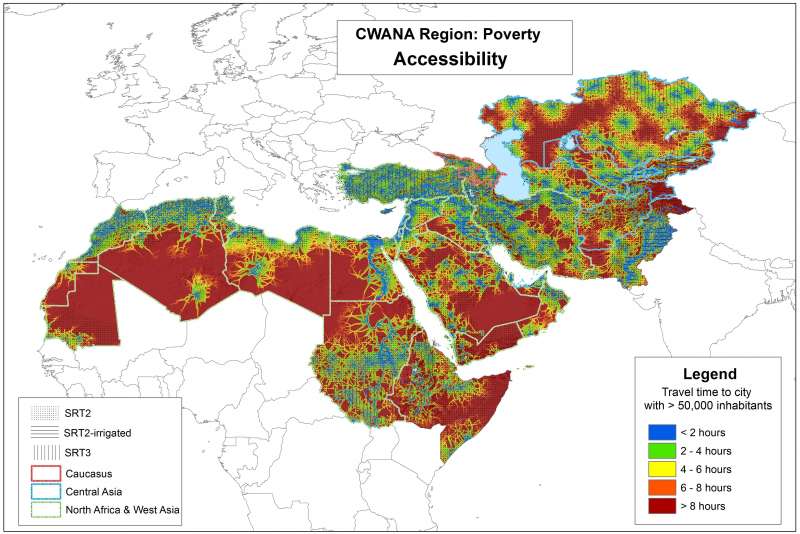
Accessibility to markets
This map shows travel time to cities with at least 50,000 inhabitants as an indicator of accessibility to markets.
Metadataclose[x]
Accessibility to markets
This map shows travel time to cities with at least 50,000 inhabitants as an indicator of accessibility to markets.

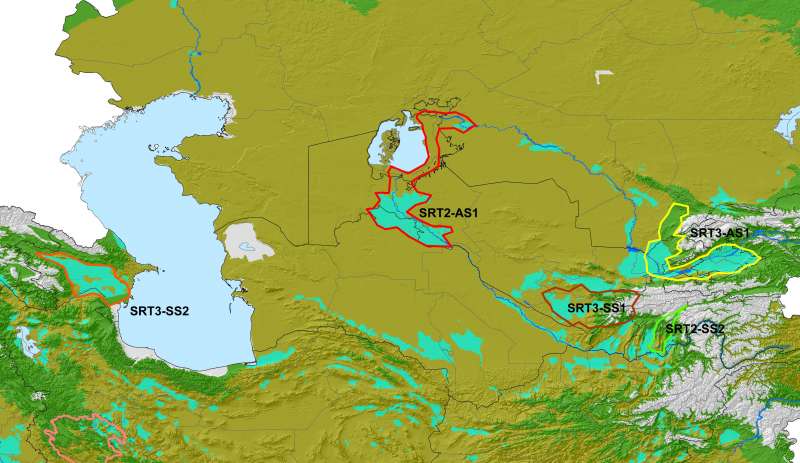
Action and satellite sites of the Central Asia target region
Whereas in the WANA region there is sufficient contiguity to spatially define Benchmark Areas, this is not the case in Central Asia, hence an exclusive focus on Action Sites and Satellite Sites. Three Action Sites and a Satellite Site are planned in Central Asia, and one Satellite Site in the Caucasus.
The Aral-Turkestan Lowland Action Site (SRT2-AS1) covers the area around the Aral Sea in Kazakhstan, Turkmenistan and Uzbekistan and will primarily focus research on land reclamation, effective water management, and soil fertility increase.
The Action Site covering the Rasht Valley in parts of Tajikistan and Kyrgyzstan (SRT2-AS2) will primarily focus research on soil erosion and landslides control, livestock improvement, and processing and marketing of local products.
In the Ferghana Valley and Southern Kazakhstan (SRT3-AS1) research will focus on Improved water management, and agro-technical measures in crop production, fruits and vegetables, livestock and fodder.
In the Kashkadarya Region Satellite Site (SRT3-SS1) research will be conducted on plant breeding and seed production.
The Satellite Site in the Caucasus (the Kura-Araks Lowland, SRT3-SS2) will focus research on improvement of irrigation schemes and de-salinization of soils.
Metadataclose[x]
Action and satellite sites of the Central Asia target region
Whereas in the WANA region there is sufficient contiguity to spatially define Benchmark Areas, this is not the case in Central Asia, hence an exclusive focus on Action Sites and Satellite Sites. Three Action Sites and a Satellite Site are planned in Central Asia, and one Satellite Site in the Caucasus.
The Aral-Turkestan Lowland Action Site (SRT2-AS1) covers the area around the Aral Sea in Kazakhstan, Turkmenistan and Uzbekistan and will primarily focus research on land reclamation, effective water management, and soil fertility increase.
The Action Site covering the Rasht Valley in parts of Tajikistan and Kyrgyzstan (SRT2-AS2) will primarily focus research on soil erosion and landslides control, livestock improvement, and processing and marketing of local products.
In the Ferghana Valley and Southern Kazakhstan (SRT3-AS1) research will focus on Improved water management, and agro-technical measures in crop production, fruits and vegetables, livestock and fodder.
In the Kashkadarya Region Satellite Site (SRT3-SS1) research will be conducted on plant breeding and seed production.
The Satellite Site in the Caucasus (the Kura-Araks Lowland, SRT3-SS2) will focus research on improvement of irrigation schemes and de-salinization of soils.

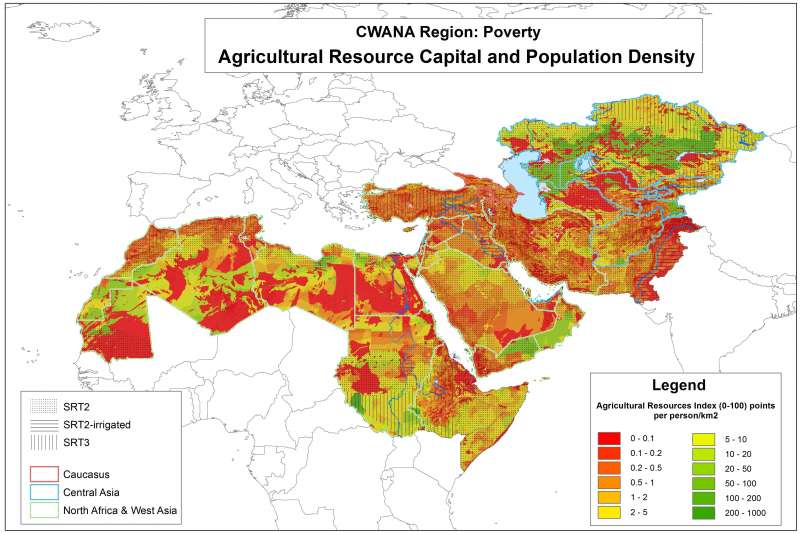
Agricultural Resource Capital and Population Density
A high-potential agricultural resource base can be insufficient for a large rural population, whereas areas with lower potential for agriculture but also lower population densities can be sustainable. This map links agricultural resource poverty to population density.
Metadataclose[x]
Agricultural Resource Capital and Population Density
A high-potential agricultural resource base can be insufficient for a large rural population, whereas areas with lower potential for agriculture but also lower population densities can be sustainable. This map links agricultural resource poverty to population density.

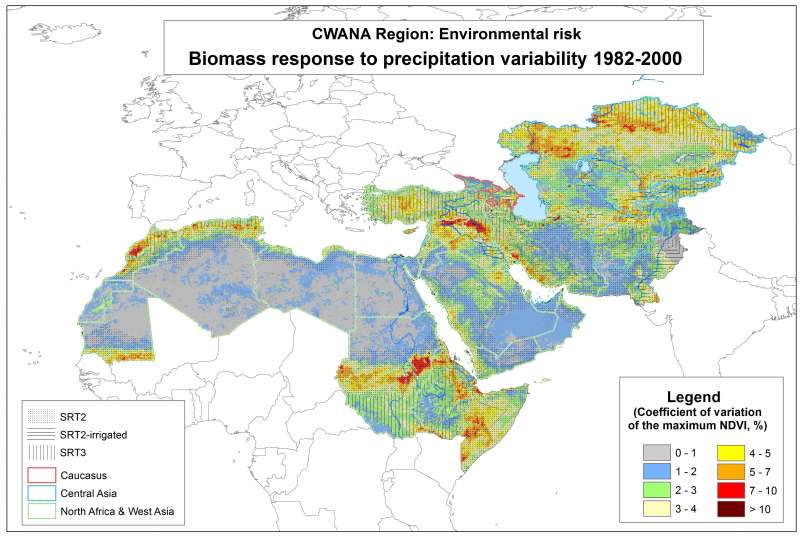
Biomass response to precipitation variability 1982-2000
This map shows the coefficient of variation of the maximum NDVI for the period 1982-2000, which is an indicator of the fluctuations in agricultural or natural biomass, which do not result from land use change and are related to current climatic variability.
The colors in orange and red express where the variability is the highest. As the CV of the maximum NDVI expresses the response of the vegetation biomass to climatic fluctuations, it is an impact indicator and hence evidence of the presence of ‘hot’ or ‘cool’ spots in different parts of CWANA.
The map shows several current hot spots:
- North Africa, from Morocco into Tunisia
- The Sahel, from Mauritania into Sudan, Eritrea, northern Ethiopia and turning south into Somalia
- The Fertile Crescent, from northern Syria, Kurdistan, turning southeast into Kuzistan and southern Iran
- The foothill zone north of the Tien-Shan and Pamir Central Asia mountain ranges
- The rangelands in the north of Central Asia
All these areas are characterized by severe droughts, degradation of land, water and vegetation resources, and sometimes famines.
Metadataclose[x]
Biomass response to precipitation variability 1982-2000
This map shows the coefficient of variation of the maximum NDVI for the period 1982-2000, which is an indicator of the fluctuations in agricultural or natural biomass, which do not result from land use change and are related to current climatic variability.
The colors in orange and red express where the variability is the highest. As the CV of the maximum NDVI expresses the response of the vegetation biomass to climatic fluctuations, it is an impact indicator and hence evidence of the presence of ‘hot’ or ‘cool’ spots in different parts of CWANA.
The map shows several current hot spots:
- North Africa, from Morocco into Tunisia
- The Sahel, from Mauritania into Sudan, Eritrea, northern Ethiopia and turning south into Somalia
- The Fertile Crescent, from northern Syria, Kurdistan, turning southeast into Kuzistan and southern Iran
- The foothill zone north of the Tien-Shan and Pamir Central Asia mountain ranges
- The rangelands in the north of Central Asia
All these areas are characterized by severe droughts, degradation of land, water and vegetation resources, and sometimes famines.

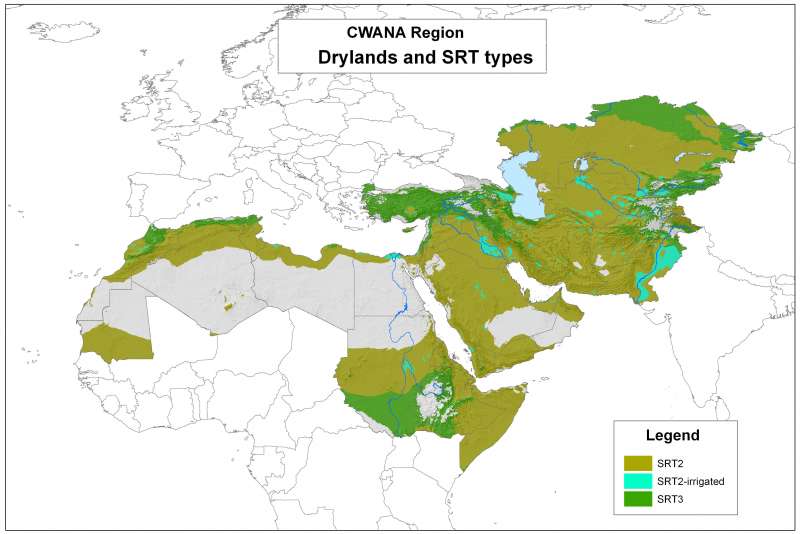
Drylands and SRT types
This map shows which drylands belong to the SRT2 category (requiring vulnerability and risk reduction) and which ones to the SRT3 category (with possibilities for sustainable intensification). The subdivision is entirely based on the value of the aridity index (ratio of mean annual precipitation over mean annual potential evapotranspiration), with a value below 0.35 for SRT2 areas and equal to or greater than 0.35 for SRT3 areas. This is by necessity a gross simplification as production and livelihood systems’ vulnerability and intensification potential are not only determined by a simple climatic indicator but, perhaps more importantly, by socioeconomic factors as well. However, the latter are difficult to put on a map and there is no denying that in drylands the moisture regime is a major determinant of vulnerability and intensification potential. To accommodate irrigated areas in very dry areas an intermediate category (SRT2-irrigated), which may have aspects of both vulnerability (e.g. depleting water resources, salinization) and intensification potential (e.g. water saving technologies, addressing yield gaps).
Metadataclose[x]
Drylands and SRT types
This map shows which drylands belong to the SRT2 category (requiring vulnerability and risk reduction) and which ones to the SRT3 category (with possibilities for sustainable intensification). The subdivision is entirely based on the value of the aridity index (ratio of mean annual precipitation over mean annual potential evapotranspiration), with a value below 0.35 for SRT2 areas and equal to or greater than 0.35 for SRT3 areas. This is by necessity a gross simplification as production and livelihood systems’ vulnerability and intensification potential are not only determined by a simple climatic indicator but, perhaps more importantly, by socioeconomic factors as well. However, the latter are difficult to put on a map and there is no denying that in drylands the moisture regime is a major determinant of vulnerability and intensification potential. To accommodate irrigated areas in very dry areas an intermediate category (SRT2-irrigated), which may have aspects of both vulnerability (e.g. depleting water resources, salinization) and intensification potential (e.g. water saving technologies, addressing yield gaps).

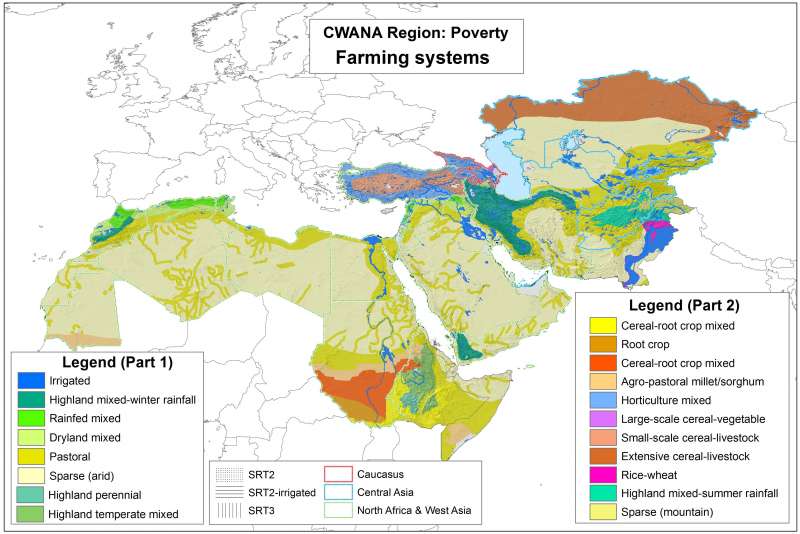
Farming systems
This map differentiates 19 farming systems on the basis of the classification developed by Dixon et al (2001, see Data source). It illustrates the diversity of the production systems and their adaptation to highly diverse environments. In a general way, the agricultural systems of these regions can be subdivided into 3 groups: (a) rainfall-based systems; (b) irrigated systems; and (c) intermediate systems. The latter rely on spatially and temporally variable mixes of rain and irrigation water. Although overlap is considerable, these systems occupy specific segments of the aridity spectrum. The irrigated systems constitute the only notable exception, since they occur under all aridity regimes. As aridity increases, the diversity in agricultural systems drops. The systems also occupy an amazing range of thermal climates, ranging from tropical to temperate continental.
Metadataclose[x]
Farming systems
This map differentiates 19 farming systems on the basis of the classification developed by Dixon et al (2001, see Data source). It illustrates the diversity of the production systems and their adaptation to highly diverse environments. In a general way, the agricultural systems of these regions can be subdivided into 3 groups: (a) rainfall-based systems; (b) irrigated systems; and (c) intermediate systems. The latter rely on spatially and temporally variable mixes of rain and irrigation water. Although overlap is considerable, these systems occupy specific segments of the aridity spectrum. The irrigated systems constitute the only notable exception, since they occur under all aridity regimes. As aridity increases, the diversity in agricultural systems drops. The systems also occupy an amazing range of thermal climates, ranging from tropical to temperate continental.

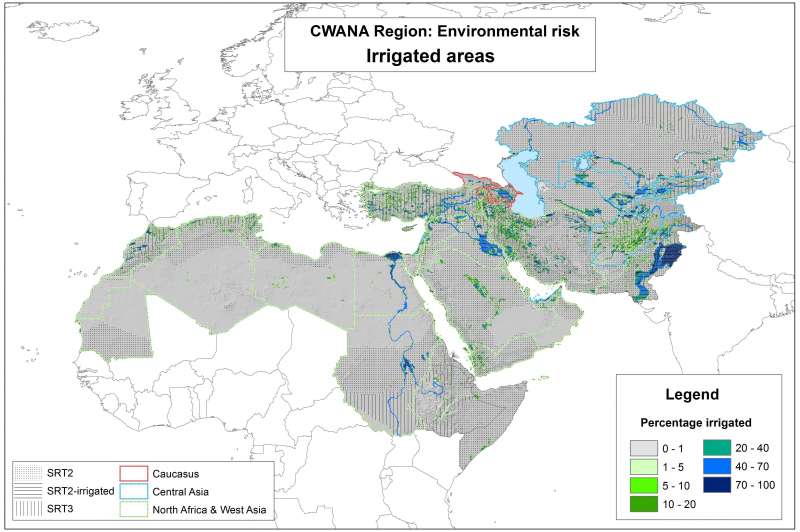
Irrigated areas
This map shows the percentage of land that is irrigated. Whereas irrigation is the ultimate solution for agricultural water shortage, this map makes clear that only a small fraction of the drylands is irrigated, although there are major differences between individual countries (-> Statistical Tables).
Metadataclose[x]
Irrigated areas
This map shows the percentage of land that is irrigated. Whereas irrigation is the ultimate solution for agricultural water shortage, this map makes clear that only a small fraction of the drylands is irrigated, although there are major differences between individual countries (-> Statistical Tables).

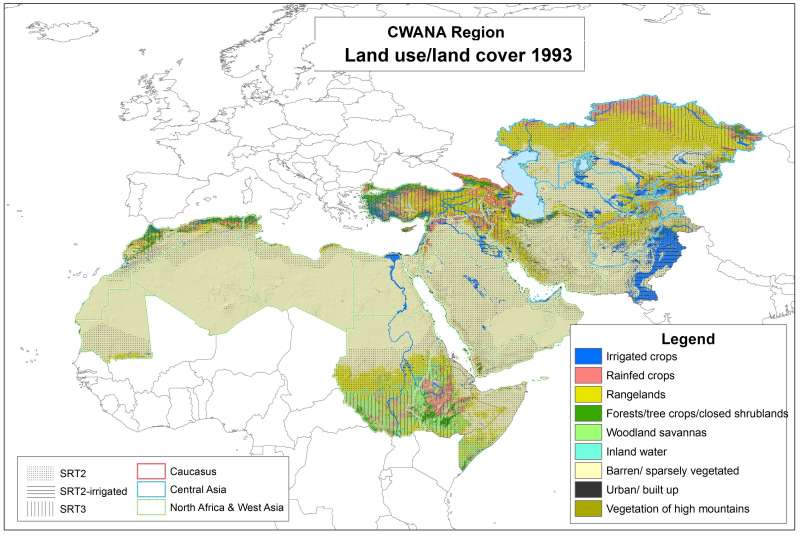
Land use/land cover 1993
This map shows an 8-class land use/land cover map, compiled by aggregation of an initial 12-class land use/land cover classification based on image analysis of AVHRR data at 1-km spatial resolution for the period April 1992 to March 1993. The main approach used for building up the classification was a hierarchical decision-tree with sliding thresholds for the annual minimum, maximum and mean NDVI, which varied according to the agroclimatic zone.
Metadataclose[x]
Land use/land cover 1993
This map shows an 8-class land use/land cover map, compiled by aggregation of an initial 12-class land use/land cover classification based on image analysis of AVHRR data at 1-km spatial resolution for the period April 1992 to March 1993. The main approach used for building up the classification was a hierarchical decision-tree with sliding thresholds for the annual minimum, maximum and mean NDVI, which varied according to the agroclimatic zone.

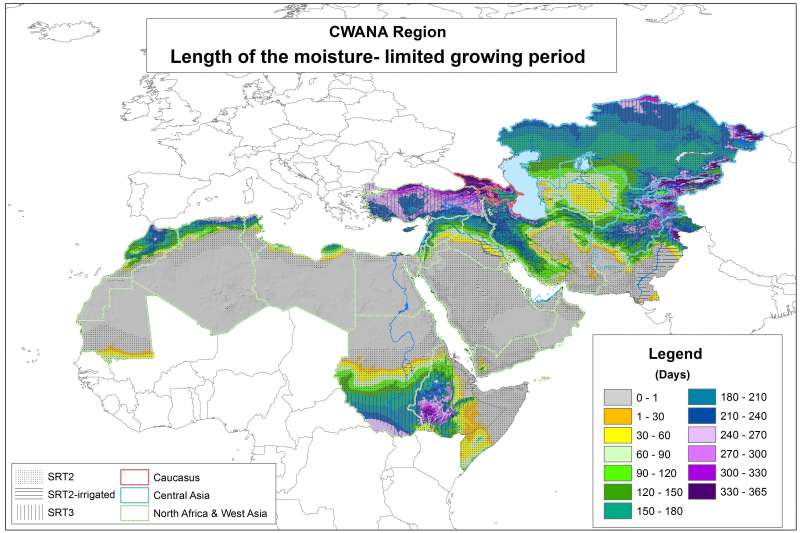
Length of the moisture-limited growing period
The climatic growing period is calculated by means of a model developed by the Food and Agriculture Organization of the United Nations (FAO, 1978) to estimate the length of growing period under either moisture-limiting or temperature-limiting conditions, or both. Under rainfed conditions, both moisture and temperature can be limited. Under irrigated conditions, only temperature is to be considered a limiting factor.
The moisture-limited growing period is calculated, using a waterbalance approach, as the ratio of actual evapotranspiration (AET) to potential evapotranspiration (PET). If this ratio for any particular month is higher than a user-defined threshold (in this study 0.5), that month is part of a growing period. If it is not, that month is not part of the growing period. The start date of the moisture-limited growing period is obtained from linear interpolation of the AET/PET ratios between the last month that is not part of the growing period, and the first month that is part of the growing period. The end date, inversely, is obtained by linear interpolation of the AET/PET ratios between the last month that is part of the growing period, and the first one that is not part of the growing period.
Metadataclose[x]
Length of the moisture-limited growing period
The climatic growing period is calculated by means of a model developed by the Food and Agriculture Organization of the United Nations (FAO, 1978) to estimate the length of growing period under either moisture-limiting or temperature-limiting conditions, or both. Under rainfed conditions, both moisture and temperature can be limited. Under irrigated conditions, only temperature is to be considered a limiting factor.
The moisture-limited growing period is calculated, using a waterbalance approach, as the ratio of actual evapotranspiration (AET) to potential evapotranspiration (PET). If this ratio for any particular month is higher than a user-defined threshold (in this study 0.5), that month is part of a growing period. If it is not, that month is not part of the growing period. The start date of the moisture-limited growing period is obtained from linear interpolation of the AET/PET ratios between the last month that is not part of the growing period, and the first month that is part of the growing period. The end date, inversely, is obtained by linear interpolation of the AET/PET ratios between the last month that is part of the growing period, and the first one that is not part of the growing period.