


Geoinformatics Solutions for Integrated Agro-ecosystems Research
GIS Data
Maps in: Central Asia

Farming systems
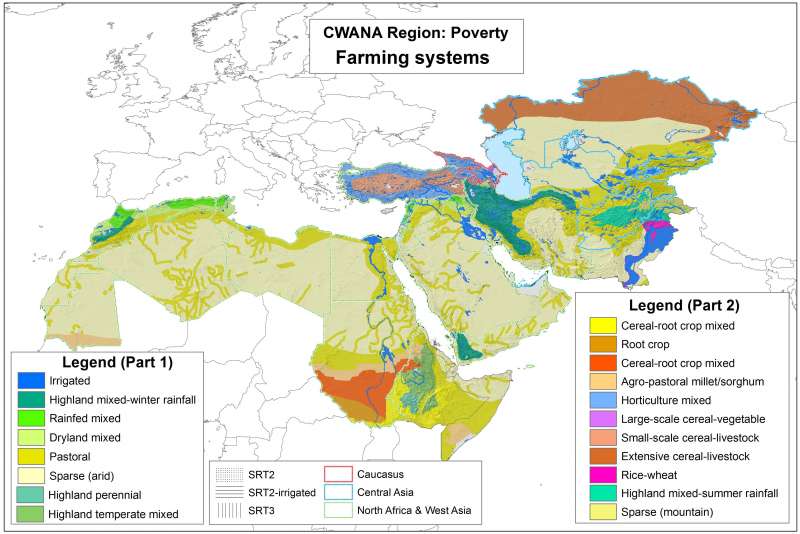
This map differentiates 19 farming systems on the basis of the classification developed by Dixon et al (2001, see Data source). It illustrates the diversity of the production systems and their adaptation to highly diverse environments. In a general way, the agricultural systems of these regions can be subdivided into 3 groups: (a) rainfall-based systems; (b) irrigated systems; and (c) intermediate systems. The latter rely on spatially and temporally variable mixes of rain and irrigation water. Although overlap is considerable, these systems occupy specific segments of the aridity spectrum. The irrigated systems constitute the only notable exception, since they occur under all aridity regimes. As aridity increases, the diversity in agricultural systems drops. The systems also occupy an amazing range of thermal climates, ranging from tropical to temperate continental.
Metadataclose[x]
Farming systems
This map differentiates 19 farming systems on the basis of the classification developed by Dixon et al (2001, see Data source). It illustrates the diversity of the production systems and their adaptation to highly diverse environments. In a general way, the agricultural systems of these regions can be subdivided into 3 groups: (a) rainfall-based systems; (b) irrigated systems; and (c) intermediate systems. The latter rely on spatially and temporally variable mixes of rain and irrigation water. Although overlap is considerable, these systems occupy specific segments of the aridity spectrum. The irrigated systems constitute the only notable exception, since they occur under all aridity regimes. As aridity increases, the diversity in agricultural systems drops. The systems also occupy an amazing range of thermal climates, ranging from tropical to temperate continental.

Length of the moisture-limited growing period
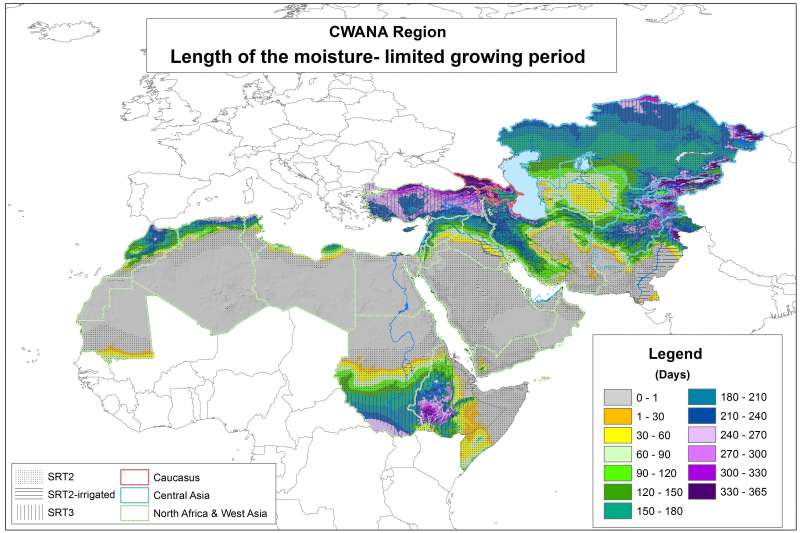
The climatic growing period is calculated by means of a model developed by the Food and Agriculture Organization of the United Nations (FAO, 1978) to estimate the length of growing period under either moisture-limiting or temperature-limiting conditions, or both. Under rainfed conditions, both moisture and temperature can be limited. Under irrigated conditions, only temperature is to be considered a limiting factor.
The moisture-limited growing period is calculated, using a waterbalance approach, as the ratio of actual evapotranspiration (AET) to potential evapotranspiration (PET). If this ratio for any particular month is higher than a user-defined threshold (in this study 0.5), that month is part of a growing period. If it is not, that month is not part of the growing period. The start date of the moisture-limited growing period is obtained from linear interpolation of the AET/PET ratios between the last month that is not part of the growing period, and the first month that is part of the growing period. The end date, inversely, is obtained by linear interpolation of the AET/PET ratios between the last month that is part of the growing period, and the first one that is not part of the growing period.
Metadataclose[x]
Length of the moisture-limited growing period
The climatic growing period is calculated by means of a model developed by the Food and Agriculture Organization of the United Nations (FAO, 1978) to estimate the length of growing period under either moisture-limiting or temperature-limiting conditions, or both. Under rainfed conditions, both moisture and temperature can be limited. Under irrigated conditions, only temperature is to be considered a limiting factor.
The moisture-limited growing period is calculated, using a waterbalance approach, as the ratio of actual evapotranspiration (AET) to potential evapotranspiration (PET). If this ratio for any particular month is higher than a user-defined threshold (in this study 0.5), that month is part of a growing period. If it is not, that month is not part of the growing period. The start date of the moisture-limited growing period is obtained from linear interpolation of the AET/PET ratios between the last month that is not part of the growing period, and the first month that is part of the growing period. The end date, inversely, is obtained by linear interpolation of the AET/PET ratios between the last month that is part of the growing period, and the first one that is not part of the growing period.

Relative change in annual trend precipitation 1901-2007
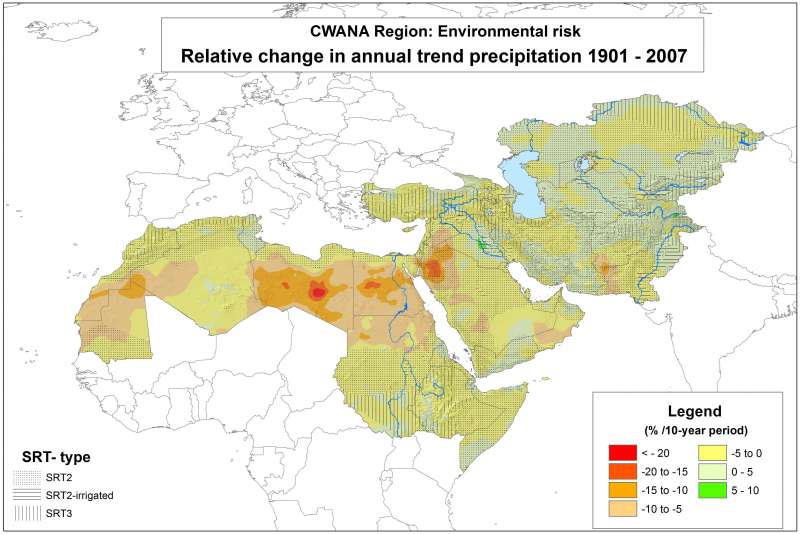
This map is based on the Full Data Reanalysis Product Version 4 of the Global Precipitation Climatology Centre (GPCC). It has been obtained by linear regression fitted to the 107-year time series of annual precipitation of each 0.5x0.5 degree grid cell by the least-squares method and subsequent resampling to 0.008333 degree (about 1 km) spatial resolution. The map shows the average relative change between 2007 and 1901 in percent per decade (10-year period) as measured along the trend line.
In spite of the high year-to-year variability, there is a clear and often highly significant trend, which is mostly negative (0-5% decrease/decade), with a positive increase in parts of Central Asia. Only in some of the extremely dry parts of the region, this simple linear model leads to an obvious overestimation of change (areas mapped as having 15 to over 30% relative change of annual precipitation per decade).
Metadataclose[x]
Relative change in annual trend precipitation 1901-2007
This map is based on the Full Data Reanalysis Product Version 4 of the Global Precipitation Climatology Centre (GPCC). It has been obtained by linear regression fitted to the 107-year time series of annual precipitation of each 0.5x0.5 degree grid cell by the least-squares method and subsequent resampling to 0.008333 degree (about 1 km) spatial resolution. The map shows the average relative change between 2007 and 1901 in percent per decade (10-year period) as measured along the trend line.
In spite of the high year-to-year variability, there is a clear and often highly significant trend, which is mostly negative (0-5% decrease/decade), with a positive increase in parts of Central Asia. Only in some of the extremely dry parts of the region, this simple linear model leads to an obvious overestimation of change (areas mapped as having 15 to over 30% relative change of annual precipitation per decade).

Agricultural Resource Capital and Population Density
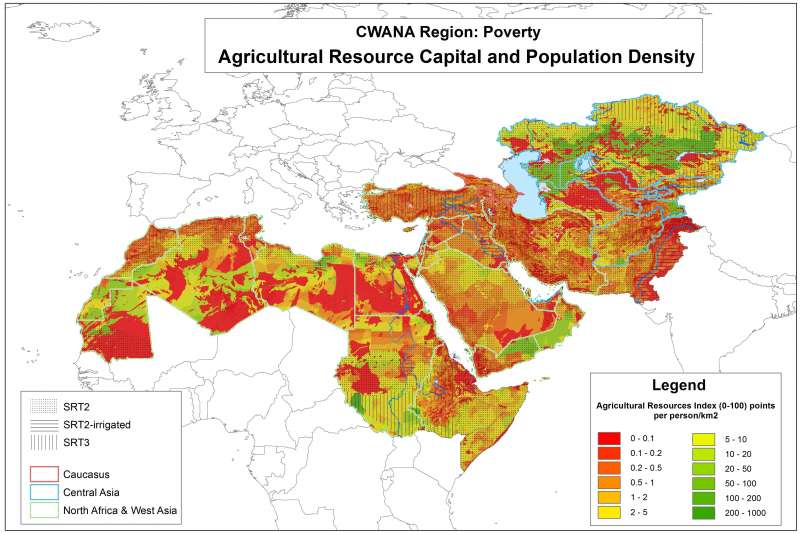
A high-potential agricultural resource base can be insufficient for a large rural population, whereas areas with lower potential for agriculture but also lower population densities can be sustainable. This map links agricultural resource poverty to population density.
Metadataclose[x]
Agricultural Resource Capital and Population Density
A high-potential agricultural resource base can be insufficient for a large rural population, whereas areas with lower potential for agriculture but also lower population densities can be sustainable. This map links agricultural resource poverty to population density.

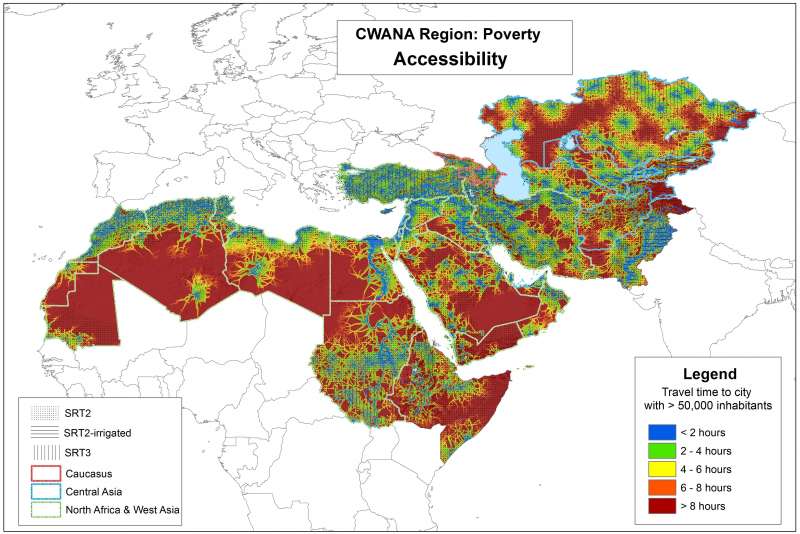
Accessibility to markets
This map shows travel time to cities with at least 50,000 inhabitants as an indicator of accessibility to markets.
Metadataclose[x]
Accessibility to markets
This map shows travel time to cities with at least 50,000 inhabitants as an indicator of accessibility to markets.