Maps in: South Asia

Sort: date   title
Items per page: 10  25  50   Switch
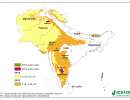
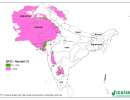
SRT2&3-type drylands: action sites


Metadataclose[x]

SRT2&3-type drylands: action sites

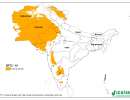
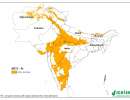
SRT2-type drylands: aridity index


SRT2-type drylands: aridity index

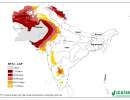
The Global-Aridity surface shows moisture availability for potential growth of reference vegetation excluding the impact of soil mediating water runoff events. UNEP (UNEP 1997) breaks up Aridity Index, in the traditional classification scheme presented below. 
Value Climate Class
< 0.03
Hyper Arid
0.03 – 0.2
Arid
0.2 – 0.5
Semi-Arid
0.5 – 0.65
Dry sub-humid
> 0.65
Humid

Metadata Download Full Metadata

Metadataclose[x]

SRT2-type drylands: aridity index

The Global-Aridity surface shows moisture availability for potential growth of reference vegetation excluding the impact of soil mediating water runoff events. UNEP (UNEP 1997) breaks up Aridity Index, in the traditional classification scheme presented below. 
Value Climate Class
< 0.03
Hyper Arid
0.03 – 0.2
Arid
0.2 – 0.5
Semi-Arid
0.5 – 0.65
Dry sub-humid
> 0.65
Humid
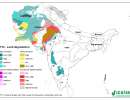
SRT2-type drylands: land degradation


SRT2-type drylands: land degradation

Global Assessment of Human-induced Soil Degradation (GLASOD)
The GLASOD project (1987-1990) has produced a world map of human-induced soil degradation. Data were compiled in cooperation with a large number of soil scientists throughout the world, using uniform Guidelines and international correlation. The status of soil degradation was mapped within loosely defined physiographic units (polygons), based on expert judgement. The type, extent, degree, rate and main causes of degradation have been printed on a global map, at a scale of 1:10 million, and documented in a downloadable database. Information about the areal extent of human-induced soil degradation can be found in an explanatory note.

Metadata Download Full Metadata

Metadataclose[x]

SRT2-type drylands: land degradation

Global Assessment of Human-induced Soil Degradation (GLASOD)
The GLASOD project (1987-1990) has produced a world map of human-induced soil degradation. Data were compiled in cooperation with a large number of soil scientists throughout the world, using uniform Guidelines and international correlation. The status of soil degradation was mapped within loosely defined physiographic units (polygons), based on expert judgement. The type, extent, degree, rate and main causes of degradation have been printed on a global map, at a scale of 1:10 million, and documented in a downloadable database. Information about the areal extent of human-induced soil degradation can be found in an explanatory note.
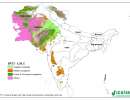
SRT2-type drylands: land use/land cover


SRT2-type drylands: land use/land cover

The GlobCover Project

Overview

The GLOBCOVER project was launched 2004 as an initiative of ESA which is now evolving to an international collaboration between ESA, FAO, UNEP, JRC, IGBP and GOFC-GOLD. The objective of GLOBCOVER is to produce a global land-cover map for the year 2005, using as main source of data the fine resolution (300 m) mode data from MERIS sensor on-board ENVISAT satellite, acquired over the full year 2005. This new product intends to complement and update other existing comparable global products, such as the global land cover map for the year 2000 (GLC 2000) with a resolution of 1 km produced by the JRC. Appropriate approaches for the validation of the land cover products are planned to be defined in consultation with CEOS.

GlobCover 2009 land cover map (1 product a year):
The land cover map is derived by an automatic and regionally-tuned classification of a time series of global MERIS FR mosaics for the year 2009. The global land cover map counts 22 land cover classes defined with the United Nations (UN) Land Cover Classification System (LCCS).

Metadata Download Full Metadata

Metadataclose[x]

SRT2-type drylands: land use/land cover

The GlobCover Project

Overview

The GLOBCOVER project was launched 2004 as an initiative of ESA which is now evolving to an international collaboration between ESA, FAO, UNEP, JRC, IGBP and GOFC-GOLD. The objective of GLOBCOVER is to produce a global land-cover map for the year 2005, using as main source of data the fine resolution (300 m) mode data from MERIS sensor on-board ENVISAT satellite, acquired over the full year 2005. This new product intends to complement and update other existing comparable global products, such as the global land cover map for the year 2000 (GLC 2000) with a resolution of 1 km produced by the JRC. Appropriate approaches for the validation of the land cover products are planned to be defined in consultation with CEOS.

GlobCover 2009 land cover map (1 product a year):
The land cover map is derived by an automatic and regionally-tuned classification of a time series of global MERIS FR mosaics for the year 2009. The global land cover map counts 22 land cover classes defined with the United Nations (UN) Land Cover Classification System (LCCS).
SRT2-type drylands: length of growing period


SRT2-type drylands: length of growing period

This is the period during the year when both moisture availability and temperature are conducive to crop growth. Thus, in a formal sense, LGP refers to the number of days within LGPwhen moisture conditions are considered adequate.

Metadata Download Full Metadata

Metadataclose[x]

SRT2-type drylands: length of growing period

This is the period during the year when both moisture availability and temperature are conducive to crop growth. Thus, in a formal sense, LGP refers to the number of days within LGPwhen moisture conditions are considered adequate.

SRT2-type drylands: malnutrition/stunting data


SRT2-type drylands: malnutrition/stunting data

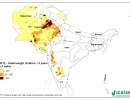
The Global Subnational Prevalence of Child Malnutrition dataset consists of estimates of the percentage of children with weight-for-age z-scores that are more than two standard deviations below the median of the NCHS/CDC/WHO International Reference Population. Data are reported for the most recent year with subnational information available at the time of development. The data products include a shapefile (vector data) of percentage rates, grids (raster data) of rates (per thousand in order to preserve precision in integer format), the number of children under five (the rate denominator), and the number of underweight children under five (the rate numerator), and a tabular dataset of the same and associated data. This dataset is produced by the Columbia University Center for International Earth Science Information Network (CIESIN).
The global data sets include two proxy poverty measurements: Infant Mortality Rates and Malnutrition (underweight children), all translated to a common quarter-degree grid. A quarter-degree grid cell is approximately 770 square kilometers (300 square miles) at the equator, and progressively less at higher latitudes.
Originator: Center for International Earth Science Information Network (CIESIN), Columbia University
Publication Date: 2005
Title: Poverty Mapping Project: Global Subnational Prevalence of Child Malnutrition
Geospatial Data Presentation Form: raster digital data, vector digital data, tabular digital data, map
Publication Information:
Publication Place: Palisades, NY
Publisher: CIESIN, Columbia University

Metadata Download Full Metadata

Metadataclose[x]

SRT2-type drylands: malnutrition/stunting data

The Global Subnational Prevalence of Child Malnutrition dataset consists of estimates of the percentage of children with weight-for-age z-scores that are more than two standard deviations below the median of the NCHS/CDC/WHO International Reference Population. Data are reported for the most recent year with subnational information available at the time of development. The data products include a shapefile (vector data) of percentage rates, grids (raster data) of rates (per thousand in order to preserve precision in integer format), the number of children under five (the rate denominator), and the number of underweight children under five (the rate numerator), and a tabular dataset of the same and associated data. This dataset is produced by the Columbia University Center for International Earth Science Information Network (CIESIN).
The global data sets include two proxy poverty measurements: Infant Mortality Rates and Malnutrition (underweight children), all translated to a common quarter-degree grid. A quarter-degree grid cell is approximately 770 square kilometers (300 square miles) at the equator, and progressively less at higher latitudes.
Originator: Center for International Earth Science Information Network (CIESIN), Columbia University
Publication Date: 2005
Title: Poverty Mapping Project: Global Subnational Prevalence of Child Malnutrition
Geospatial Data Presentation Form: raster digital data, vector digital data, tabular digital data, map
Publication Information:
Publication Place: Palisades, NY
Publisher: CIESIN, Columbia University
SRT2-type drylands: market access


SRT2-type drylands: market access

Travel time to major cities: A global map of Accessibility.
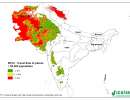
The world is shrinking. Cheap flights, large scale commercial shipping and expanding road networks, only 10% of the land area is remote – more than 48 hours from a large city.This means that we are better connected to everywhere else than ever before. But global travel and international trade and just two of the forces that have reshaped our world. A new map of Travel Time to Major Cities - developed by the European Commission and the World Bank - captures this connectivity and the concentration of economic activity and also highlights that there is little wilderness left. The map shows how accessible some parts of the world have become whilst other regions have remained isolated. Accessibility - whether it is to markets, schools, hospitals or water - is a precondition for the satisfaction of almost any economic need. Furthermore, accessibility is relevant at all levels, from local development to global trade and this map fills an important gap in our understanding of the spatial patterns of economic, physical and social connectivity.
Accessibility maps are made for a specific purpose and they cannot be used as a generic dataset to represent "the" accessibility for a given study area. The data described and presented here were used to create an urban/rural population gradient around large cities of 50,000 or more people. The assumptions made in the generation of this accessibility map can be found in the description and data sources links on the left. If these assumptions sound reasonable for your requirements then the data are available for download. If, however, the assumptions do not match your requirements then you can use the information in these pages as well as the software and external links to create your own accessibility model.

This map was made for the World Bank's World Development Report 2009 Reshaping Economic Geography. The message of the report can be summarised as: Concentration & density. 95% of the people live on just 10% of the land "As economies grow from low to high income, production becomes more concentrated spatially. Some places—cities, coastal areas, and connected countries—are favored by producers. The way to get both the immediate benefits of concentration of production and the long-term benefits of a convergence in living standards is economic integration." (WDR 2009, Overview). For measuring the concentration of economic activity, instead of using binary distinctions of rural versus urban, the report takes advantage of global accessibility measures which can be combined with data on population density to create a much finer typology which is termed the Agglomeration Index (AI). The global map of travel time to major cities (cities of 50,000 or more people in year 2000) is a useful dataset in its own right, but it is also a component of the AI. This is described further in:

Uchida, H. and Nelson, A. Agglomeration Index: Towards a New Measure of Urban Concentration. Background paper for the World Bank’s World Development Report 2009.

Uchida, H. and Nelson, A. (accepted) Agglomeration Index: Towards a New Measure of Urban Concentration. In: Guha-Khasnobis, B. (Ed), Development in an Urban World, UNU-WIDER

Metadata Download Full Metadata

Metadataclose[x]

SRT2-type drylands: market access

Travel time to major cities: A global map of Accessibility.
The world is shrinking. Cheap flights, large scale commercial shipping and expanding road networks, only 10% of the land area is remote – more than 48 hours from a large city.This means that we are better connected to everywhere else than ever before. But global travel and international trade and just two of the forces that have reshaped our world. A new map of Travel Time to Major Cities - developed by the European Commission and the World Bank - captures this connectivity and the concentration of economic activity and also highlights that there is little wilderness left. The map shows how accessible some parts of the world have become whilst other regions have remained isolated. Accessibility - whether it is to markets, schools, hospitals or water - is a precondition for the satisfaction of almost any economic need. Furthermore, accessibility is relevant at all levels, from local development to global trade and this map fills an important gap in our understanding of the spatial patterns of economic, physical and social connectivity.
Accessibility maps are made for a specific purpose and they cannot be used as a generic dataset to represent "the" accessibility for a given study area. The data described and presented here were used to create an urban/rural population gradient around large cities of 50,000 or more people. The assumptions made in the generation of this accessibility map can be found in the description and data sources links on the left. If these assumptions sound reasonable for your requirements then the data are available for download. If, however, the assumptions do not match your requirements then you can use the information in these pages as well as the software and external links to create your own accessibility model.

This map was made for the World Bank's World Development Report 2009 Reshaping Economic Geography. The message of the report can be summarised as: Concentration & density. 95% of the people live on just 10% of the land "As economies grow from low to high income, production becomes more concentrated spatially. Some places—cities, coastal areas, and connected countries—are favored by producers. The way to get both the immediate benefits of concentration of production and the long-term benefits of a convergence in living standards is economic integration." (WDR 2009, Overview). For measuring the concentration of economic activity, instead of using binary distinctions of rural versus urban, the report takes advantage of global accessibility measures which can be combined with data on population density to create a much finer typology which is termed the Agglomeration Index (AI). The global map of travel time to major cities (cities of 50,000 or more people in year 2000) is a useful dataset in its own right, but it is also a component of the AI. This is described further in:

Uchida, H. and Nelson, A. Agglomeration Index: Towards a New Measure of Urban Concentration. Background paper for the World Bank’s World Development Report 2009.

Uchida, H. and Nelson, A. (accepted) Agglomeration Index: Towards a New Measure of Urban Concentration. In: Guha-Khasnobis, B. (Ed), Development in an Urban World, UNU-WIDER

SRT2-type drylands: population density


SRT2-type drylands: population density


Gridded Population of the World, version 3 (GPWv3)

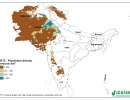
Center for International Earth Science Information Network (CIESIN), Columbia University; and Centro Internacional de Agricultura Tropical (CIAT). 2005. Gridded Population of the World Version 3 (GPWv3). Palisades, NY: Socioeconomic Data and Applications Center (SEDAC), Columbia University. Available at http://sedac.ciesin.columbia.edu/gpw.

Population Density Grids

Center for International Earth Science Information Network (CIESIN), Columbia University; and Centro Internacional de Agricultura Tropical (CIAT). 2005. Gridded Population of the World Version 3 (GPWv3): Population Density Grids. Palisades, NY: Socioeconomic Data and Applications Center (SEDAC), Columbia University. Available at http://sedac.ciesin.columbia.edu/gpw.

Metadata Download Full Metadata

Metadataclose[x]

SRT2-type drylands: population density


Gridded Population of the World, version 3 (GPWv3)

Center for International Earth Science Information Network (CIESIN), Columbia University; and Centro Internacional de Agricultura Tropical (CIAT). 2005. Gridded Population of the World Version 3 (GPWv3). Palisades, NY: Socioeconomic Data and Applications Center (SEDAC), Columbia University. Available at http://sedac.ciesin.columbia.edu/gpw.

Population Density Grids

Center for International Earth Science Information Network (CIESIN), Columbia University; and Centro Internacional de Agricultura Tropical (CIAT). 2005. Gridded Population of the World Version 3 (GPWv3): Population Density Grids. Palisades, NY: Socioeconomic Data and Applications Center (SEDAC), Columbia University. Available at http://sedac.ciesin.columbia.edu/gpw.

SRT2-type drylands: rainfall variability


Metadataclose[x]

SRT2-type drylands: rainfall variability

SRT3-type drylands: aridity index


SRT3-type drylands: aridity index

The Global-Aridity surface shows moisture availability for potential growth of reference vegetation excluding the impact of soil mediating water runoff events. UNEP (UNEP 1997) breaks up Aridity Index, in the traditional classification scheme presented below. 
Value Climate Class
< 0.03
Hyper Arid
0.03 – 0.2
Arid
0.2 – 0.5
Semi-Arid
0.5 – 0.65
Dry sub-humid
> 0.65
Humid

Metadata Download Full Metadata

Metadataclose[x]

SRT3-type drylands: aridity index

The Global-Aridity surface shows moisture availability for potential growth of reference vegetation excluding the impact of soil mediating water runoff events. UNEP (UNEP 1997) breaks up Aridity Index, in the traditional classification scheme presented below. 
Value Climate Class
< 0.03
Hyper Arid
0.03 – 0.2
Arid
0.2 – 0.5
Semi-Arid
0.5 – 0.65
Dry sub-humid
> 0.65
Humid

User Registrationclose[x]


User Login

Messageclose[x]

Message Body Goes Here

Messageclose[x]

Profile page goes here

Data Requestclose[x]

Data Requestclose[x]