


Geoinformatics Solutions for Integrated Agro-ecosystems Research
GIS Data
Maps in: Climate

Agroclimatic Zones in CWANA and Eurasia
Agroclimatic Zones in the Central and West Asia - North Africa and Eurasia regions
Metadataclose[x]
Agroclimatic Zones in CWANA and Eurasia
Building a new eco-climatic database was established consisting of GIS layers of soil and climatic parameters at 1 km resolution, covering the entire CWANA and Eurasia region.
Agroclimatic Zones in the Central and West Asia - North Africa and Eurasia regions
International Center for Agricultural Research in the Dry Areas (ICARDA)
2008
climate, agroclimatic zones
CWANA, Eurasia
45.602975
48.672963
39.698607
37.231951
D_WGS_1984
WGS_1984
6378137.000000
298.257224

Aridity in CWANA and Eurasia
Aridity Index in the Central and West Asia - North Africa and Eurasia regions
Metadataclose[x]
Aridity in CWANA and Eurasia
Building a new eco-climatic database was established consisting of GIS layers of soil and climatic parameters at 1 km resolution, covering the entire CWANA and Eurasia region.
Aridity Index in the Central and West Asia - North Africa and Eurasia regions
International Center for Agricultural Research in the Dry Areas (ICARDA)
2008
climate, aridity index
CWANA, Eurasia
45.602975
48.672963
39.698607
37.231951
D_WGS_1984
WGS_1984
6378137.000000
298.257224

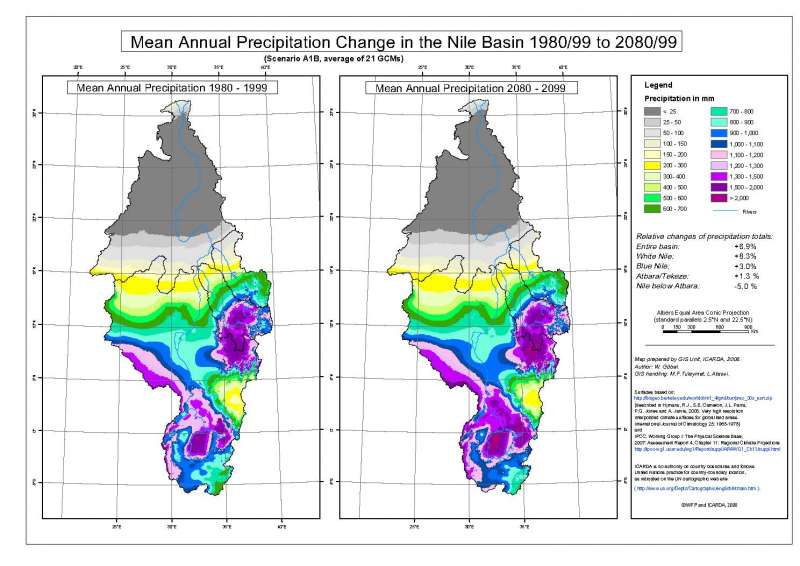
Atbara/Tekeze basin: Annual Precipitation 2080-2099
Mean annual precipitation 2080-2099 in the Atbara/Tekeze drainage basin.
Metadataclose[x]
Atbara/Tekeze basin: Annual Precipitation 2080-2099
WFP Workshop on "Climate Change and Food Security", Cairo, Egypt, 3-4 November 2008
Mean annual precipitation 2080-2099 in the Atbara/Tekeze drainage basin.
International Center for Agricultural Research in the Dry Areas (ICARDA)
2008
Future climate, temperature
CWANA, Egypt, Nile basin
33.839945
39.996773
19.127797
11.636838
D_WGS_1984
WGS_1984
6378137.000000
298.257224
Atbara/Tekeze Basin: Annual Temperature 1980-1999
Mean annual precipitation 1980-1999 in the Atbara/Tekeze drainage basin.
Metadataclose[x]
Atbara/Tekeze Basin: Annual Temperature 1980-1999
WFP Workshop on "Climate Change and Food Security", Cairo, Egypt, 3-4 November 2008
Mean annual precipitation 1980-1999 in the Atbara/Tekeze drainage basin.
International Center for Agricultural Research in the Dry Areas (ICARDA)
2008
Future climate, temperature
CWANA, Egypt, Nile basin
33.839945
39.996773
19.127797
11.636838
D_WGS_1984
WGS_1984
6378137.000000
298.257224

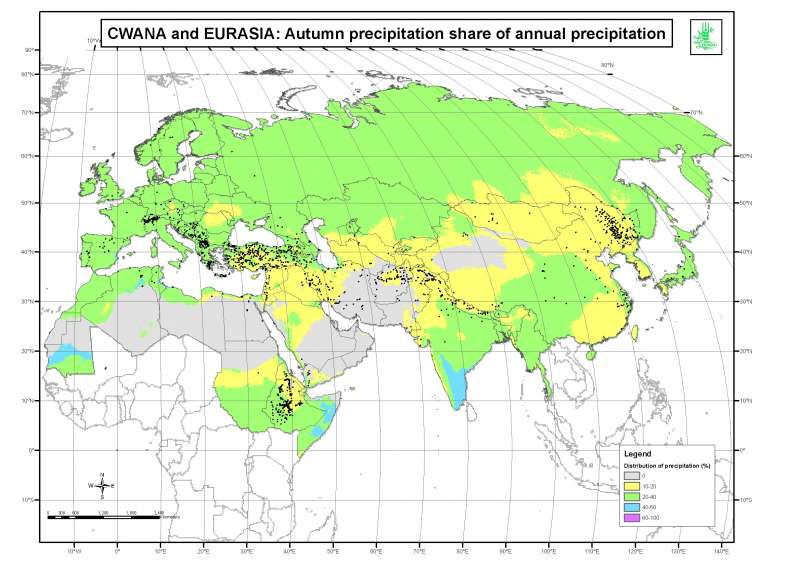
Autumn Precipitation in CWANA and Eurasia
Average autumn precipitation (September, October, November) in the Central and West Asia - North Africa and Eurasia regions
Metadataclose[x]
Autumn Precipitation in CWANA and Eurasia
Building a new eco-climatic database was established consisting of GIS layers of soil and climatic parameters at 1 km resolution, covering the entire CWANA and Eurasia region.
Average autumn precipitation (September, October, November) in the Central and West Asia - North Africa and Eurasia regions
International Center for Agricultural Research in the Dry Areas (ICARDA)
2008
climate, autumn precipitation
CWANA, Eurasia
45.602975
48.672963
39.698607
37.231951
D_WGS_1984
WGS_1984
6378137.000000
298.257224

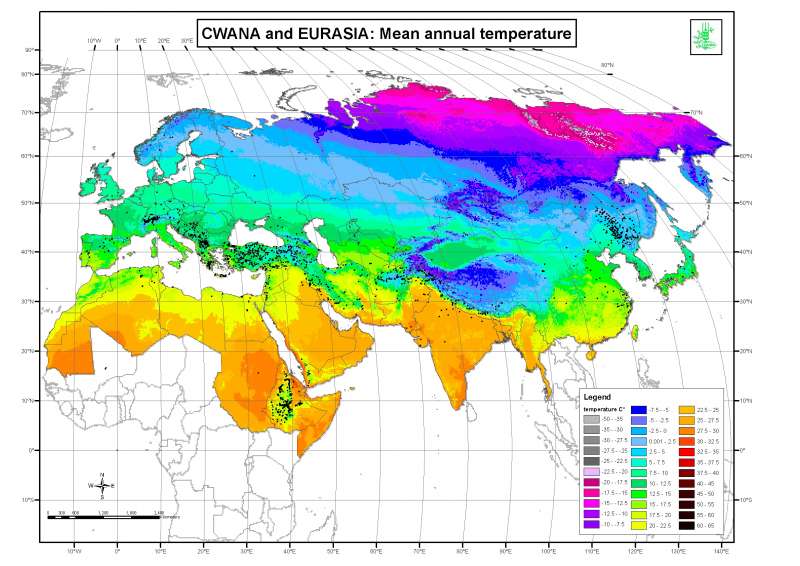
Average Temperature in CWANA and Eurasia
Annual mean temperature in the Central and West Asia - North Africa and Eurasia regions
Metadataclose[x]
Average Temperature in CWANA and Eurasia
Building a new eco-climatic database was established consisting of GIS layers of soil and climatic parameters at 1 km resolution, covering the entire CWANA and Eurasia region.
Annual mean temperature in the Central and West Asia - North Africa and Eurasia regions
International Center for Agricultural Research in the Dry Areas (ICARDA)
2008
climate, average temperature
CWANA, Eurasia
-17.103181
180.005152
77.734305
-1.657362
D_WGS_1984
WGS_1984
6378137.000000
298.257224
Blue Nile Basin: Annual Precipitation 1980-1999
Mean annual precipitation 1980-1999 in the Blue Nile drainage basin.
Metadataclose[x]
Blue Nile Basin: Annual Precipitation 1980-1999
WFP Workshop on "Climate Change and Food Security", Cairo, Egypt, 3-4 November 2008
Mean annual precipitation 1980-1999 in the Blue Nile drainage basin.
International Center for Agricultural Research in the Dry Areas (ICARDA)
2008
Future climate, temperature
CWANA, Egypt, Nile basin
32.406404
40.021245
16.013213
7.158201
D_WGS_1984
WGS_1984
6378137.000000
298.257224
Blue Nile Basin: Annual Precipitation 2080-2099
Mean annual precipitation 2080-2099 in the Blue Nile drainage basin.
Metadataclose[x]
Blue Nile Basin: Annual Precipitation 2080-2099
WFP Workshop on "Climate Change and Food Security", Cairo, Egypt, 3-4 November 2008
Mean annual precipitation 2080-2099 in the Blue Nile drainage basin.
International Center for Agricultural Research in the Dry Areas (ICARDA)
2008
Future climate, temperature
CWANA, Egypt, Nile basin
32.406404
40.021245
16.013213
7.158201
D_WGS_1984
WGS_1984
6378137.000000
298.257224
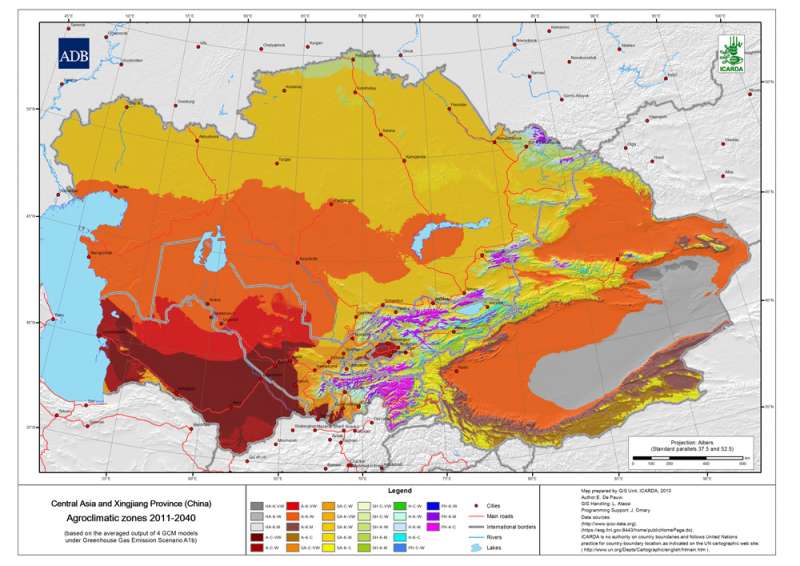
 Agroclimatic zones 2011-2040 A1b Scenario")
Central Asia and Xingjiang Province (China) Agroclimatic zones 2011-2040 A1b Scenario
Agroclimatic Zones 2011-2040 (based on the averaged output of 7 GCM models under Greenhouse Gas Emission Scenario A1b)
Metadataclose[x]
Central Asia and Xingjiang Province (China) Agroclimatic zones 2011-2040 A1b Scenario
Building a new eco-climatic database was established consisting of GIS layers of soil and climatic parameters at 1 km resolution
Agroclimatic Zones 2011-2040 (based on the averaged output of 7 GCM models under Greenhouse Gas Emission Scenario A1b)
International Center for Agricultural Research in the Dry Areas (ICARDA)
2010
Tajikistan, Turkmenistan, Kazakhstan, Uzbekistan, Kyrgyzstan, Xingjiang Province
51.218469686
103.047567786
52.69812595
32.817056204
D_WGS_1984
WGS_1984
6378137.000000
298.257224
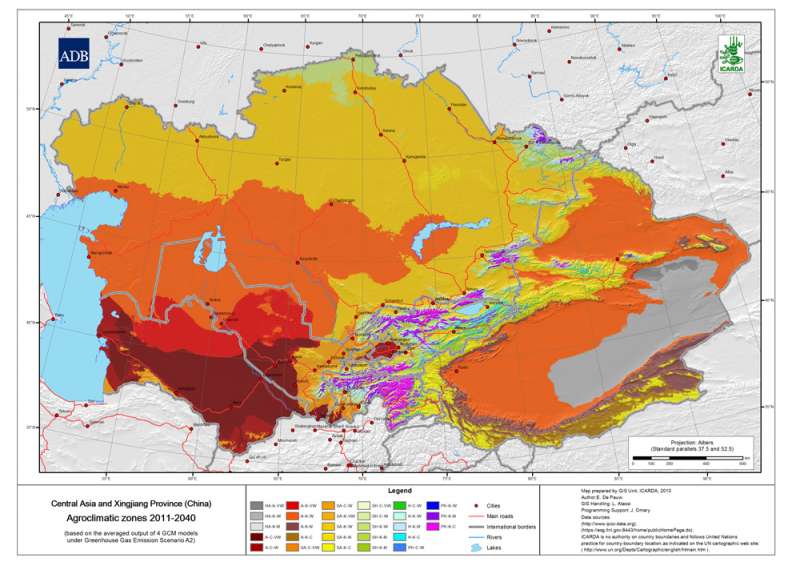
 Agroclimatic zones 2011-2040 A2 Scenario")
Central Asia and Xingjiang Province (China) Agroclimatic zones 2011-2040 A2 Scenario
Agroclimatic Zones 2011-2040 (based on the averaged output of 7 GCM models under Greenhouse Gas Emission Scenario A2)
Metadataclose[x]
Central Asia and Xingjiang Province (China) Agroclimatic zones 2011-2040 A2 Scenario
Building a new eco-climatic database was established consisting of GIS layers of soil and climatic parameters at 1 km resolution
Agroclimatic Zones 2011-2040 (based on the averaged output of 7 GCM models under Greenhouse Gas Emission Scenario A2)
International Center for Agricultural Research in the Dry Areas (ICARDA)
2010
Tajikistan, Turkmenistan, Kazakhstan, Uzbekistan, Kyrgyzstan, Xingjiang Province
51.218469686
103.047567786
52.69812595
32.817056204
D_WGS_1984
WGS_1984
6378137.000000
298.257224
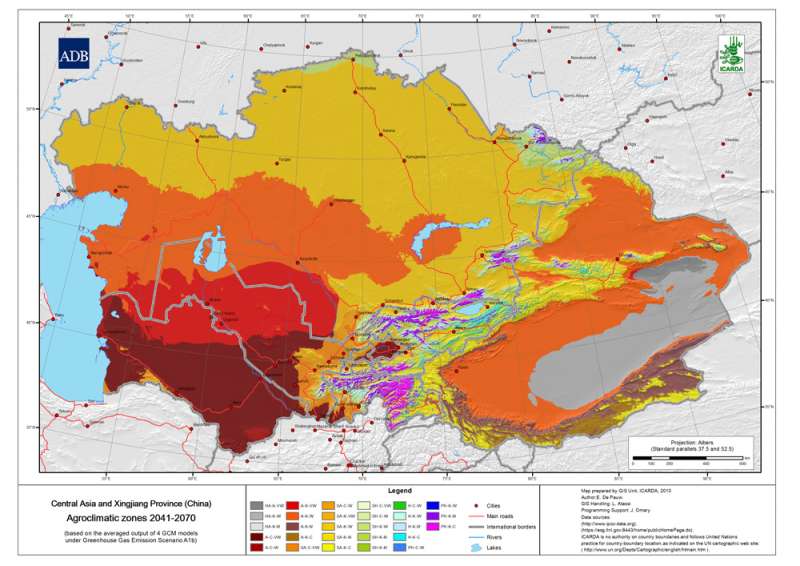
 Agroclimatic zones 2041-2070 A1b Scenario")
Central Asia and Xingjiang Province (China) Agroclimatic zones 2041-2070 A1b Scenario
Agroclimatic Zones 2041-2070 (based on the averaged output of 7 GCM models under Greenhouse Gas Emission Scenario A1b)
Metadataclose[x]
Central Asia and Xingjiang Province (China) Agroclimatic zones 2041-2070 A1b Scenario
Building a new eco-climatic database was established consisting of GIS layers of soil and climatic parameters at 1 km resolution
Agroclimatic Zones 2041-2070 (based on the averaged output of 7 GCM models under Greenhouse Gas Emission Scenario A1b)
International Center for Agricultural Research in the Dry Areas (ICARDA)
2010
Tajikistan, Turkmenistan, Kazakhstan, Uzbekistan, Kyrgyzstan, Xingjiang Province
51.218469686
103.047567786
52.69812595
32.817056204
D_WGS_1984
WGS_1984
6378137.000000
298.257224
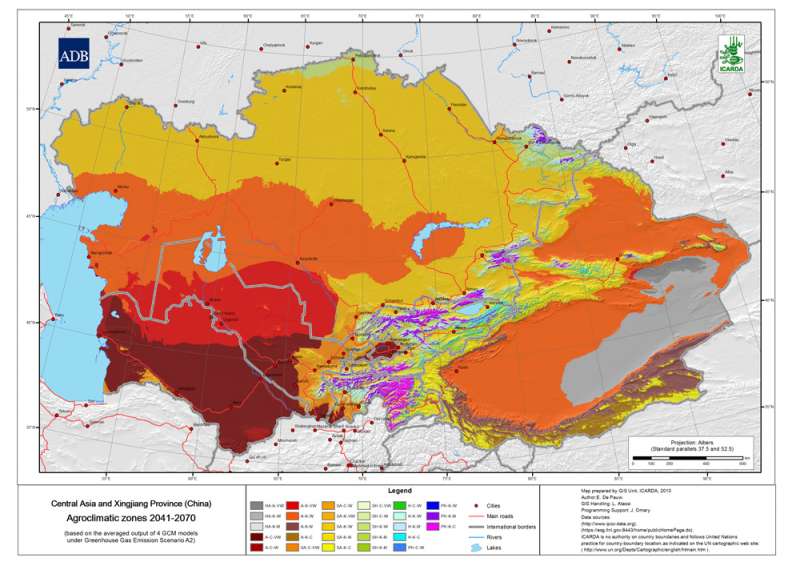
 Agroclimatic zones 2041-2070 A2 Scenario")
Central Asia and Xingjiang Province (China) Agroclimatic zones 2041-2070 A2 Scenario
Agroclimatic Zones 2041-2070 (based on the averaged output of 7 GCM models under Greenhouse Gas Emission Scenario A2)
Metadataclose[x]
Central Asia and Xingjiang Province (China) Agroclimatic zones 2041-2070 A2 Scenario
Building a new eco-climatic database was established consisting of GIS layers of soil and climatic parameters at 1 km resolution
Agroclimatic Zones 2041-2070 (based on the averaged output of 7 GCM models under Greenhouse Gas Emission Scenario A2)
International Center for Agricultural Research in the Dry Areas (ICARDA)
2010
Tajikistan, Turkmenistan, Kazakhstan, Uzbekistan, Kyrgyzstan, Xingjiang Province
51.218469686
103.047567786
52.69812595
32.817056204
D_WGS_1984
WGS_1984
6378137.000000
298.257224
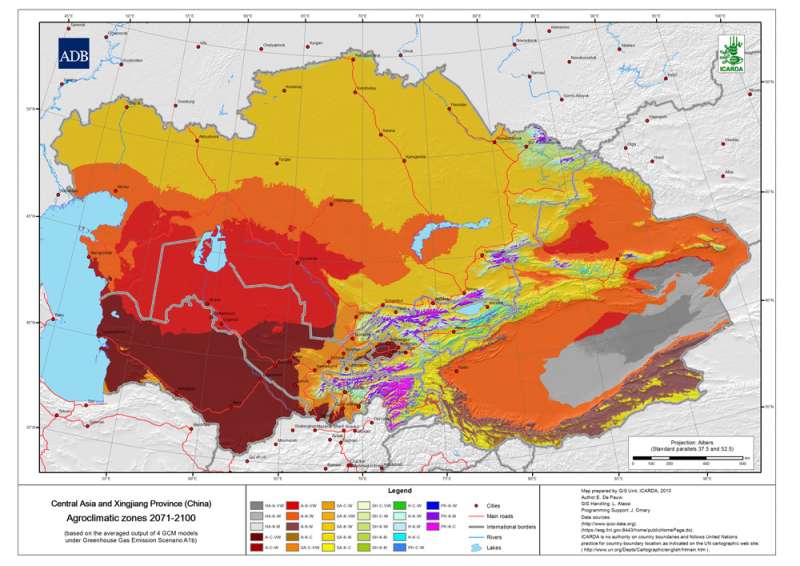
 Agroclimatic zones 2071-2100 A1b Scenario")
Central Asia and Xingjiang Province (China) Agroclimatic zones 2071-2100 A1b Scenario
Agroclimatic Zones 2071-2100 (based on the averaged output of 7 GCM models under Greenhouse Gas Emission Scenario A1b)
Metadataclose[x]
Central Asia and Xingjiang Province (China) Agroclimatic zones 2071-2100 A1b Scenario
Building a new eco-climatic database was established consisting of GIS layers of soil and climatic parameters at 1 km resolution
Agroclimatic Zones 2071-2100 (based on the averaged output of 7 GCM models under Greenhouse Gas Emission Scenario A1b)
International Center for Agricultural Research in the Dry Areas (ICARDA)
2010
Tajikistan, Turkmenistan, Kazakhstan, Uzbekistan, Kyrgyzstan, Xingjiang Province
51.218469686
103.047567786
52.69812595
32.817056204
D_WGS_1984
WGS_1984
6378137.000000
298.257224
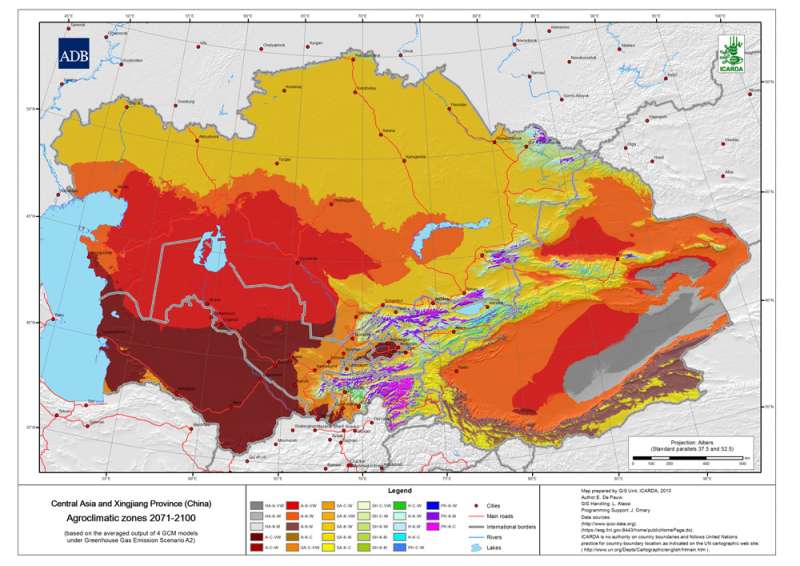
 Agroclimatic zones 2071-2100 A2 Scenario")
Central Asia and Xingjiang Province (China) Agroclimatic zones 2071-2100 A2 Scenario
Agroclimatic Zones 2071-2100 (based on the averaged output of 7 GCM models under Greenhouse Gas Emission Scenario A2)
Metadataclose[x]
Central Asia and Xingjiang Province (China) Agroclimatic zones 2071-2100 A2 Scenario
Building a new eco-climatic database was established consisting of GIS layers of soil and climatic parameters at 1 km resolution
Agroclimatic Zones 2071-2100 (based on the averaged output of 7 GCM models under Greenhouse Gas Emission Scenario A2)
International Center for Agricultural Research in the Dry Areas (ICARDA)
2010
Tajikistan, Turkmenistan, Kazakhstan, Uzbekistan, Kyrgyzstan, Xingjiang Province
51.218469686
103.047567786
52.69812595
32.817056204
D_WGS_1984
WGS_1984
6378137.000000
298.257224
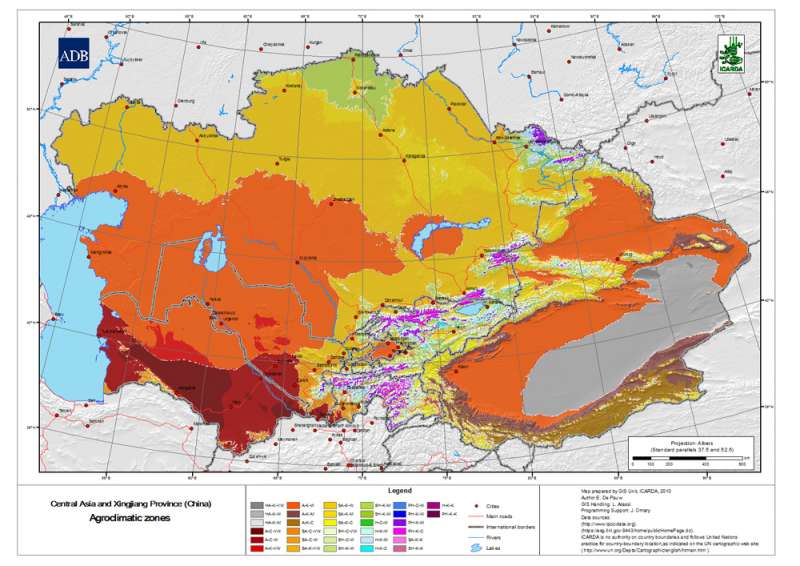
 Agroclimatic zones Current")
Central Asia and Xingjiang Province (China) Agroclimatic zones Current
Agroclimatic Zones grid for Central Asia and Xingjiang Province (China) at 30 arc-second ( about 1 km) resolution
Metadataclose[x]
Central Asia and Xingjiang Province (China) Agroclimatic zones Current
Building a new eco-climatic database was established consisting of GIS layers of soil and climatic parameters at 1 km resolution
Agroclimatic Zones grid for Central Asia and Xingjiang Province (China) at 30 arc-second ( about 1 km) resolution
International Center for Agricultural Research in the Dry Areas (ICARDA)
2010
Tajikistan, Turkmenistan, Kazakhstan, Uzbekistan, Kyrgyzstan, Xingjiang Province
51.218469686
103.047567786
52.69812595
32.817056204
D_WGS_1984
WGS_1984
6378137.000000
298.257224
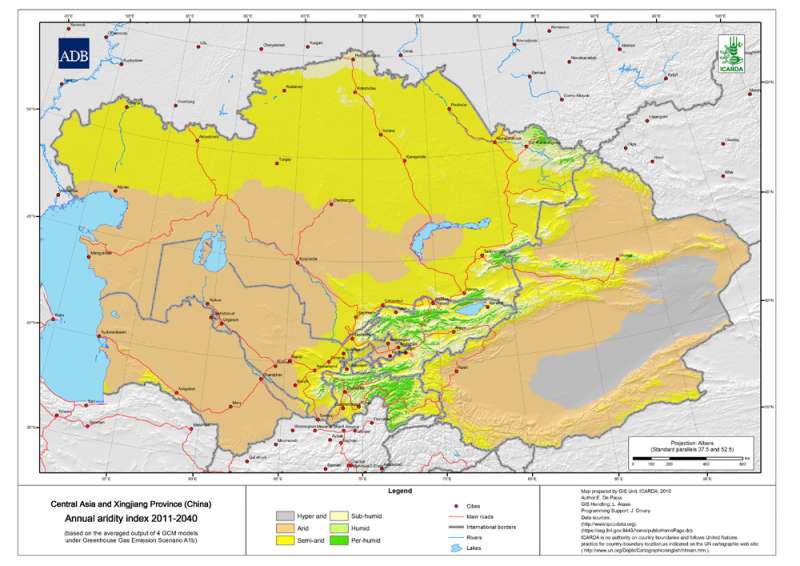
 Annual aridity index 2011-2040 A1b Scenario")
Central Asia and Xingjiang Province (China) Annual aridity index 2011-2040 A1b Scenario
Annual Aridity Index for Central Asia and Xingjiang Province (China) at 30 arc-second ( about 1 km) resolution
Metadataclose[x]
Central Asia and Xingjiang Province (China) Annual aridity index 2011-2040 A1b Scenario
To provide a measure of aridity for specific locations using an index
Annual Aridity Index for Central Asia and Xingjiang Province (China) at 30 arc-second ( about 1 km) resolution
International Center for Agricultural Research in the Dry Areas (ICARDA)
2010
Tajikistan, Turkmenistan, Kazakhstan, Uzbekistan, Kyrgyzstan, Xingjiang Province
51.218469686
103.047567786
52.69812595
32.817056204
D_WGS_1984
WGS_1984
6378137.000000
298.257224
 Annual aridity index 2011-2040 A2 Scenario")
Central Asia and Xingjiang Province (China) Annual aridity index 2011-2040 A2 Scenario
Annual Aridity Index for Central Asia and Xingjiang Province (China) at 30 arc-second ( about 1 km) resolution
Metadataclose[x]
Central Asia and Xingjiang Province (China) Annual aridity index 2011-2040 A2 Scenario
To provide a measure of aridity for specific locations using an index
Annual Aridity Index for Central Asia and Xingjiang Province (China) at 30 arc-second ( about 1 km) resolution
International Center for Agricultural Research in the Dry Areas (ICARDA)
2010
Tajikistan, Turkmenistan, Kazakhstan, Uzbekistan, Kyrgyzstan, Xingjiang Province
51.218469686
103.047567786
52.69812595
32.817056204
D_WGS_1984
WGS_1984
6378137.000000
298.257224
 Annual aridity index 2041-2070 A1b Scenario")
Central Asia and Xingjiang Province (China) Annual aridity index 2041-2070 A1b Scenario
Annual Aridity Index for Central Asia and Xingjiang Province (China) at 30 arc-second ( about 1 km) resolution
Metadataclose[x]
Central Asia and Xingjiang Province (China) Annual aridity index 2041-2070 A1b Scenario
To provide a measure of aridity for specific locations using an index
Annual Aridity Index for Central Asia and Xingjiang Province (China) at 30 arc-second ( about 1 km) resolution
International Center for Agricultural Research in the Dry Areas (ICARDA)
2010
Tajikistan, Turkmenistan, Kazakhstan, Uzbekistan, Kyrgyzstan, Xingjiang Province
51.218469686
103.047567786
52.69812595
32.817056204
D_WGS_1984
WGS_1984
6378137.000000
298.257224
 Annual aridity index 2041-2070 A2 Scenario")
Central Asia and Xingjiang Province (China) Annual aridity index 2041-2070 A2 Scenario
Annual Aridity Index for Central Asia and Xingjiang Province (China) at 30 arc-second ( about 1 km) resolution
Metadataclose[x]
Central Asia and Xingjiang Province (China) Annual aridity index 2041-2070 A2 Scenario
To provide a measure of aridity for specific locations using an index
Annual Aridity Index for Central Asia and Xingjiang Province (China) at 30 arc-second ( about 1 km) resolution
International Center for Agricultural Research in the Dry Areas (ICARDA)
2010
Tajikistan, Turkmenistan, Kazakhstan, Uzbekistan, Kyrgyzstan, Xingjiang Province
51.218469686
103.047567786
52.69812595
32.817056204
D_WGS_1984
WGS_1984
6378137.000000
298.257224
 Annual aridity index 2071-2100 A1b Scenario")
Central Asia and Xingjiang Province (China) Annual aridity index 2071-2100 A1b Scenario
Annual Aridity Index for Central Asia and Xingjiang Province (China) at 30 arc-second ( about 1 km) resolution
Metadataclose[x]
Central Asia and Xingjiang Province (China) Annual aridity index 2071-2100 A1b Scenario
To provide a measure of aridity for specific locations using an index
Annual Aridity Index for Central Asia and Xingjiang Province (China) at 30 arc-second ( about 1 km) resolution
International Center for Agricultural Research in the Dry Areas (ICARDA)
2010
Tajikistan, Turkmenistan, Kazakhstan, Uzbekistan, Kyrgyzstan, Xingjiang Province
51.218469686
103.047567786
52.69812595
32.817056204
D_WGS_1984
WGS_1984
6378137.000000
298.257224
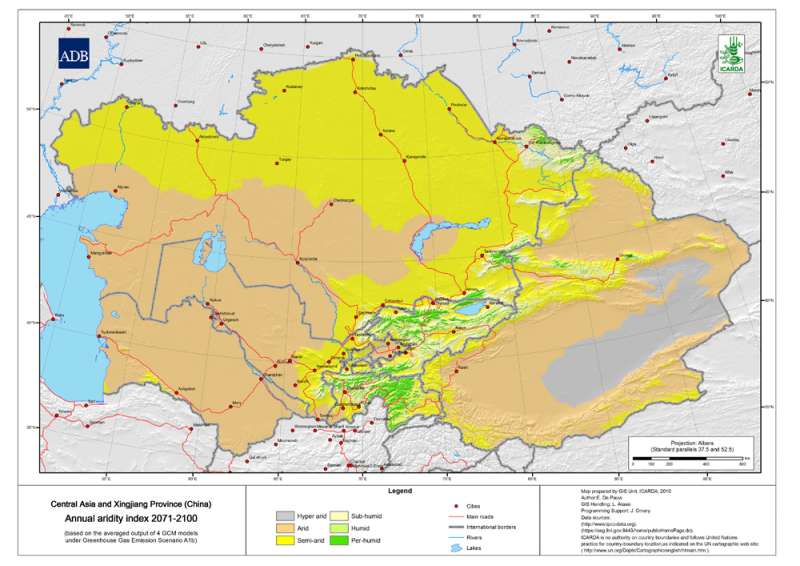
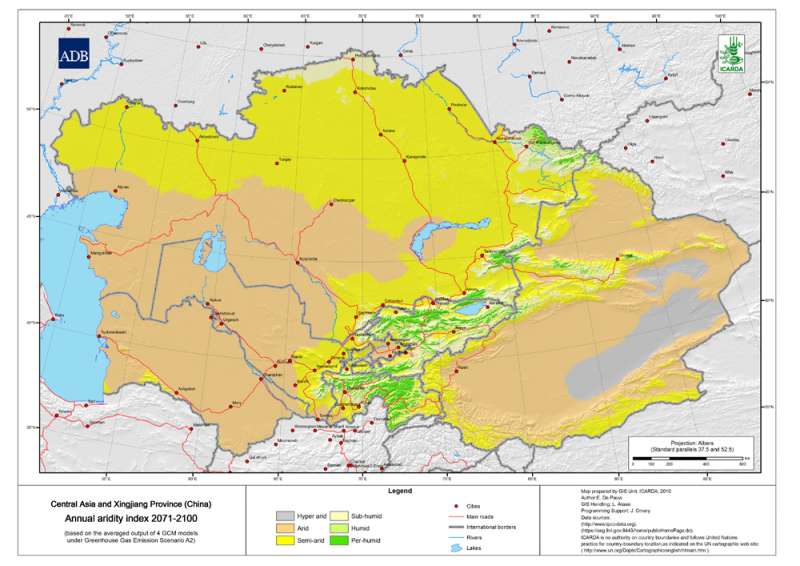
 Annual aridity index 2071-2100 A2 Scenario")
Central Asia and Xingjiang Province (China) Annual aridity index 2071-2100 A2 Scenario
Annual Aridity Index for Central Asia and Xingjiang Province (China) at 30 arc-second ( about 1 km) resolution
Metadataclose[x]
Central Asia and Xingjiang Province (China) Annual aridity index 2071-2100 A2 Scenario
To provide a measure of aridity for specific locations using an index
Annual Aridity Index for Central Asia and Xingjiang Province (China) at 30 arc-second ( about 1 km) resolution
International Center for Agricultural Research in the Dry Areas (ICARDA)
2010
Tajikistan, Turkmenistan, Kazakhstan, Uzbekistan, Kyrgyzstan, Xingjiang Province
51.218469686
103.047567786
52.69812595
32.817056204
D_WGS_1984
WGS_1984
6378137.000000
298.257224
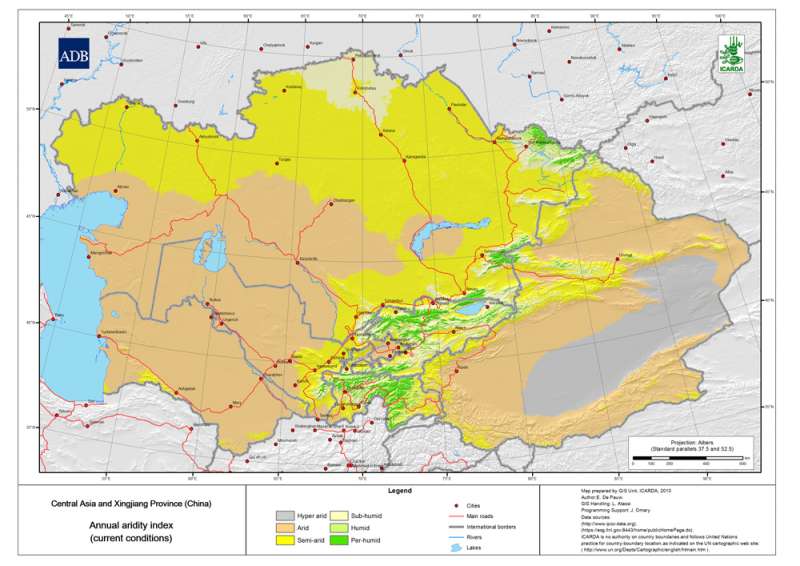
 Annual aridity index Current")
Central Asia and Xingjiang Province (China) Annual aridity index Current
Annual Aridity Index for Central Asia and Xingjiang Province (China) at 30 arc-second ( about 1 km) resolution
Metadataclose[x]
Central Asia and Xingjiang Province (China) Annual aridity index Current
To provide a measure of aridity for specific locations using an index
Annual Aridity Index for Central Asia and Xingjiang Province (China) at 30 arc-second ( about 1 km) resolution
International Center for Agricultural Research in the Dry Areas (ICARDA)
2010
Tajikistan, Turkmenistan, Kazakhstan, Uzbekistan, Kyrgyzstan, Xingjiang Province
51.218469686
103.047567786
52.69812595
32.817056204
D_WGS_1984
WGS_1984
6378137.000000
298.257224
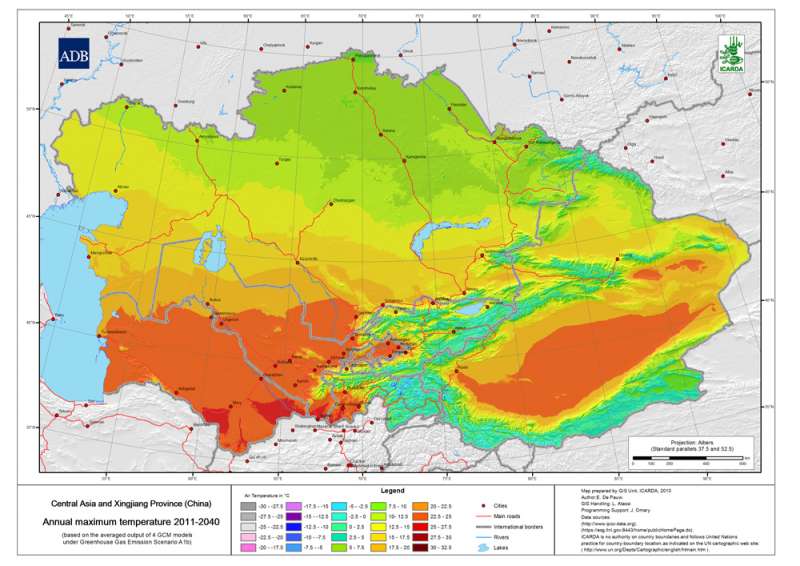
 Annual maximum temperature 2011-2040 A1b Scenario")
Central Asia and Xingjiang Province (China) Annual maximum temperature 2011-2040 A1b Scenario
Annual average of the monthly maximum temperature 2011-2040 (based on the averaged output of 7 GCM models under Greenhouse Gas Emission Scenario A1b)
Metadataclose[x]
Central Asia and Xingjiang Province (China) Annual maximum temperature 2011-2040 A1b Scenario
Baseline data to assist development agencies in planning for adaptation strategies to climate change
Annual average of the monthly maximum temperature 2011-2040 (based on the averaged output of 7 GCM models under Greenhouse Gas Emission Scenario A1b)
International Center for Agricultural Research in the Dry Areas (ICARDA)
2010
Tajikistan, Turkmenistan, Kazakhstan, Uzbekistan, Kyrgyzstan, Xingjiang Province
51.218469686
103.047567786
52.69812595
32.817056204
D_WGS_1984
WGS_1984
6378137.000000
298.257224
 Annual maximum temperature 2011-2040 A2 Scenario")
Central Asia and Xingjiang Province (China) Annual maximum temperature 2011-2040 A2 Scenario
Annual average of the monthly maximum temperature 2011-2040 (based on the averaged output of 7 GCM models under Greenhouse Gas Emission Scenario A2)
Metadataclose[x]
Central Asia and Xingjiang Province (China) Annual maximum temperature 2011-2040 A2 Scenario
Baseline data to assist development agencies in planning for adaptation strategies to climate change
Annual average of the monthly maximum temperature 2011-2040 (based on the averaged output of 7 GCM models under Greenhouse Gas Emission Scenario A2)
International Center for Agricultural Research in the Dry Areas (ICARDA)
2010
Tajikistan, Turkmenistan, Kazakhstan, Uzbekistan, Kyrgyzstan, Xingjiang Province
51.218469686
103.047567786
52.69812595
32.817056204
D_WGS_1984
WGS_1984
6378137.000000
298.257224
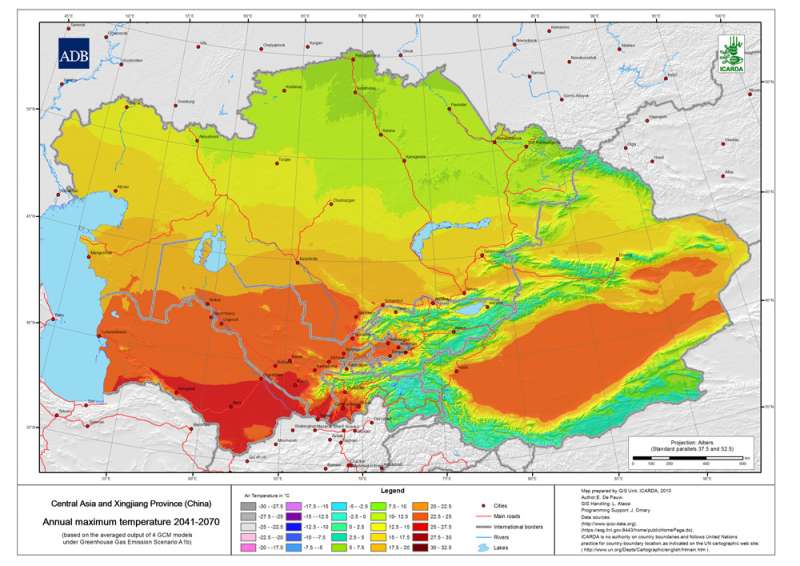
 Annual maximum temperature 2041-2070 A1b Scenario")
Central Asia and Xingjiang Province (China) Annual maximum temperature 2041-2070 A1b Scenario
Annual average of the monthly maximum temperature 2041-2070 (based on the averaged output of 7 GCM models under Greenhouse Gas Emission Scenario A1b)
Metadataclose[x]
Central Asia and Xingjiang Province (China) Annual maximum temperature 2041-2070 A1b Scenario
Baseline data to assist development agencies in planning for adaptation strategies to climate change
Annual average of the monthly maximum temperature 2041-2070 (based on the averaged output of 7 GCM models under Greenhouse Gas Emission Scenario A1b)
International Center for Agricultural Research in the Dry Areas (ICARDA)
2010
Tajikistan, Turkmenistan, Kazakhstan, Uzbekistan, Kyrgyzstan, Xingjiang Province
51.218469686
103.047567786
52.69812595
32.817056204
D_WGS_1984
WGS_1984
6378137.000000
298.257224
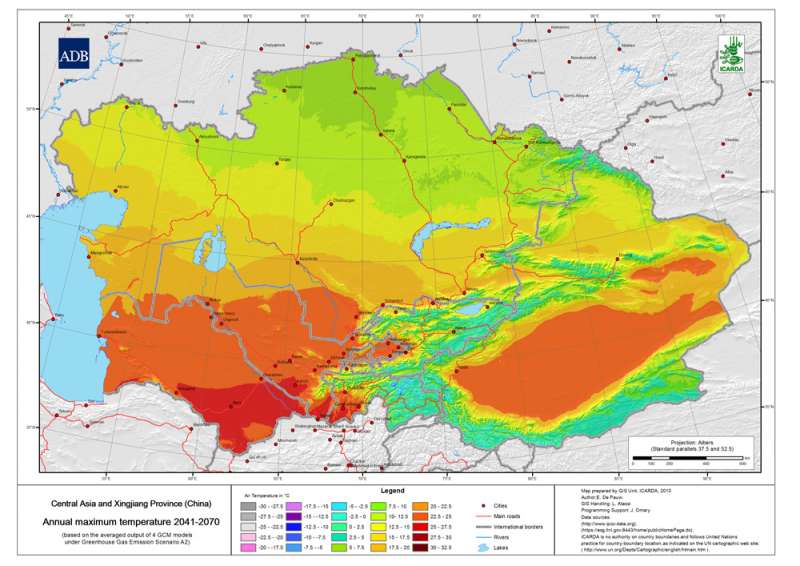
 Annual maximum temperature 2041-2070 A2 Scenario")
Central Asia and Xingjiang Province (China) Annual maximum temperature 2041-2070 A2 Scenario
Annual average of the monthly maximum temperature 2041-2070 (based on the averaged output of 7 GCM models under Greenhouse Gas Emission Scenario A2)
Metadataclose[x]
Central Asia and Xingjiang Province (China) Annual maximum temperature 2041-2070 A2 Scenario
Baseline data to assist development agencies in planning for adaptation strategies to climate change
Annual average of the monthly maximum temperature 2041-2070 (based on the averaged output of 7 GCM models under Greenhouse Gas Emission Scenario A2)
International Center for Agricultural Research in the Dry Areas (ICARDA)
2010
Tajikistan, Turkmenistan, Kazakhstan, Uzbekistan, Kyrgyzstan, Xingjiang Province
51.218469686
103.047567786
52.69812595
32.817056204
D_WGS_1984
WGS_1984
6378137.000000
298.257224
 Annual maximum temperature 2071-2100 A1b Scenario")
Central Asia and Xingjiang Province (China) Annual maximum temperature 2071-2100 A1b Scenario
Annual average of the monthly maximum temperature 2071-2100 (based on the averaged output of 7 GCM models under Greenhouse Gas Emission Scenario A1b)
Metadataclose[x]
Central Asia and Xingjiang Province (China) Annual maximum temperature 2071-2100 A1b Scenario
Baseline data to assist development agencies in planning for adaptation strategies to climate change
Annual average of the monthly maximum temperature 2071-2100 (based on the averaged output of 7 GCM models under Greenhouse Gas Emission Scenario A1b)
International Center for Agricultural Research in the Dry Areas (ICARDA)
2010
Tajikistan, Turkmenistan, Kazakhstan, Uzbekistan, Kyrgyzstan, Xingjiang Province
51.218469686
103.047567786
52.69812595
32.817056204
D_WGS_1984
WGS_1984
6378137.000000
298.257224
 Annual maximum temperature 2071-2100 A2 Scenario")
Central Asia and Xingjiang Province (China) Annual maximum temperature 2071-2100 A2 Scenario
Annual average of the monthly maximum temperature 2071-2100 (based on the averaged output of 7 GCM models under Greenhouse Gas Emission Scenario A2)
Metadataclose[x]
Central Asia and Xingjiang Province (China) Annual maximum temperature 2071-2100 A2 Scenario
Baseline data to assist development agencies in planning for adaptation strategies to climate change
Annual average of the monthly maximum temperature 2071-2100 (based on the averaged output of 7 GCM models under Greenhouse Gas Emission Scenario A2)
International Center for Agricultural Research in the Dry Areas (ICARDA)
2010
Tajikistan, Turkmenistan, Kazakhstan, Uzbekistan, Kyrgyzstan, Xingjiang Province
51.218469686
103.047567786
52.69812595
32.817056204
D_WGS_1984
WGS_1984
6378137.000000
298.257224
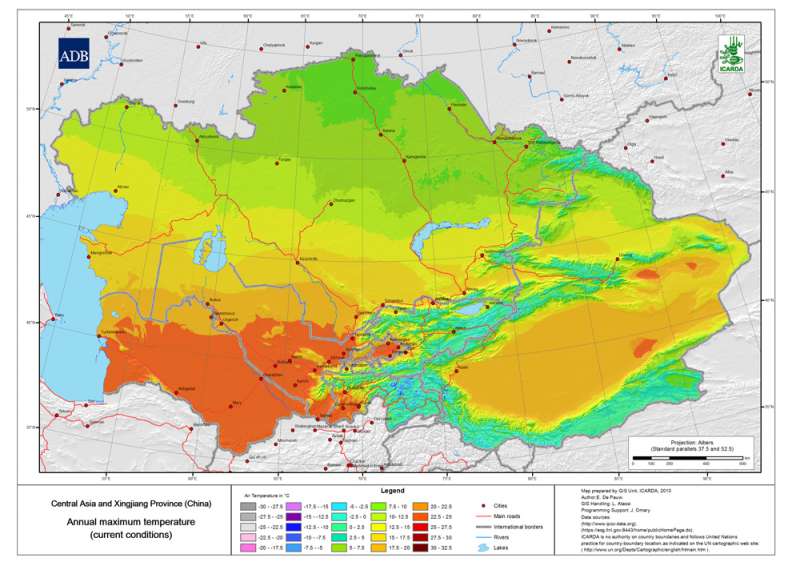
 Annual maximum temperature Current")
Central Asia and Xingjiang Province (China) Annual maximum temperature Current
Mean annual Temperature of the warmest month for Central Asia and Xingjiang Province (China) at 30 arc-second ( about 1 km) resolution
Metadataclose[x]
Central Asia and Xingjiang Province (China) Annual maximum temperature Current
An input layer to create the map of agroclimatic zones and the map of the Changes in the Annual maximum temperature of Central Asia
Mean annual Temperature of the warmest month for Central Asia and Xingjiang Province (China) at 30 arc-second ( about 1 km) resolution
International Center for Agricultural Research in the Dry Areas (ICARDA)
2010
Tajikistan, Turkmenistan, Kazakhstan, Uzbekistan, Kyrgyzstan, Xingjiang Province
51.218469686
103.047567786
52.69812595
32.817056204
D_WGS_1984
WGS_1984
6378137.000000
298.257224
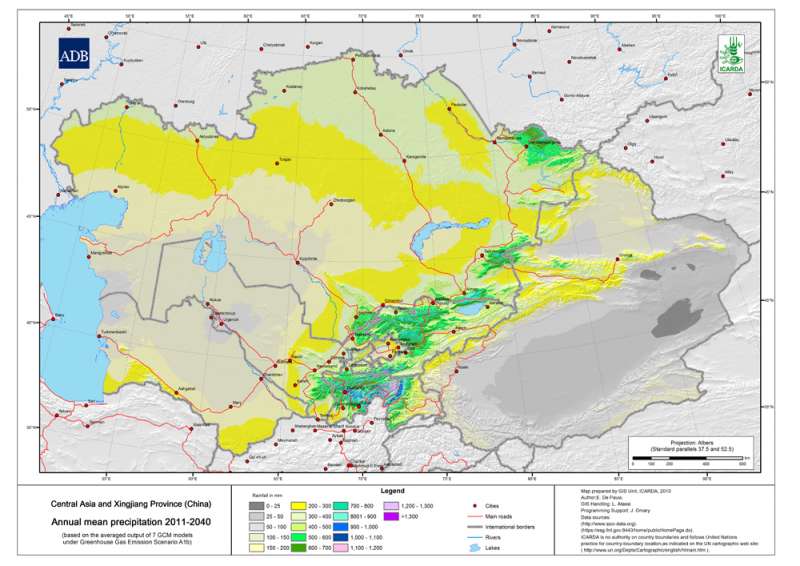
 Annual mean precipitation 2011-2040 A1b Scenario")
Central Asia and Xingjiang Province (China) Annual mean precipitation 2011-2040 A1b Scenario
Annual mean precipitation 2011-2040 (based on the averaged output of 7 GCM models under Greenhouse Gas Emission Scenario A1b)
Metadataclose[x]
Central Asia and Xingjiang Province (China) Annual mean precipitation 2011-2040 A1b Scenario
An input layer to create the map of Changes in Annual mean precipitation of Central Asia
Annual mean precipitation 2011-2040 (based on the averaged output of 7 GCM models under Greenhouse Gas Emission Scenario A1b)
International Center for Agricultural Research in the Dry Areas (ICARDA)
2010
Tajikistan, Turkmenistan, Kazakhstan, Uzbekistan, Kyrgyzstan, Xingjiang Province
51.218469686
103.047567786
52.69812595
32.817056204
D_WGS_1984
WGS_1984
6378137.000000
298.257224
 Annual mean precipitation 2011-2040 A2 Scenario")
Central Asia and Xingjiang Province (China) Annual mean precipitation 2011-2040 A2 Scenario
Annual mean precipitation 2011-2040 (based on the averaged output of 7 GCM models under Greenhouse Gas Emission Scenario A2)
Metadataclose[x]
Central Asia and Xingjiang Province (China) Annual mean precipitation 2011-2040 A2 Scenario
An input layer to create the map of Changes in Annual mean precipitation of Central Asia
Annual mean precipitation 2011-2040 (based on the averaged output of 7 GCM models under Greenhouse Gas Emission Scenario A2)
International Center for Agricultural Research in the Dry Areas (ICARDA)
2010
Tajikistan, Turkmenistan, Kazakhstan, Uzbekistan, Kyrgyzstan, Xingjiang Province
51.218469686
103.047567786
52.69812595
32.817056204
D_WGS_1984
WGS_1984
6378137.000000
298.257224
 Annual mean precipitation 2041-2070 A1b Scenario")
Central Asia and Xingjiang Province (China) Annual mean precipitation 2041-2070 A1b Scenario
Annual mean precipitation 2041-2070 (based on the averaged output of 7 GCM models under Greenhouse Gas Emission Scenario A1b)
Metadataclose[x]
Central Asia and Xingjiang Province (China) Annual mean precipitation 2041-2070 A1b Scenario
An input layer to create the map of Changes in Annual mean precipitation of Central Asia
Annual mean precipitation 2041-2070 (based on the averaged output of 7 GCM models under Greenhouse Gas Emission Scenario A1b)
International Center for Agricultural Research in the Dry Areas (ICARDA)
2010
Tajikistan, Turkmenistan, Kazakhstan, Uzbekistan, Kyrgyzstan, Xingjiang Province
51.218469686
103.047567786
52.69812595
32.817056204
D_WGS_1984
WGS_1984
6378137.000000
298.257224
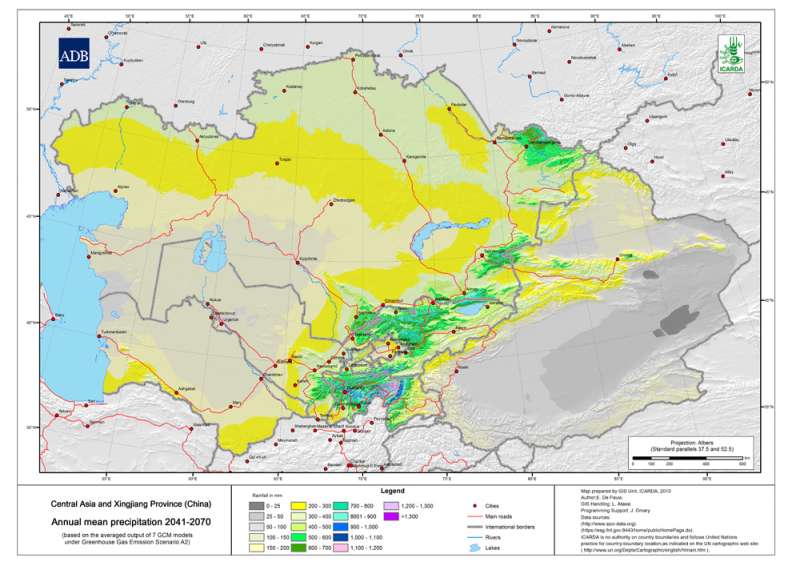
 Annual mean precipitation 2041-2070 A2 Scenario")
Central Asia and Xingjiang Province (China) Annual mean precipitation 2041-2070 A2 Scenario
Annual mean precipitation 2041-2070 (based on the averaged output of 7 GCM models under Greenhouse Gas Emission Scenario A2)
Metadataclose[x]
Central Asia and Xingjiang Province (China) Annual mean precipitation 2041-2070 A2 Scenario
An input layer to create the map of Changes in Annual mean precipitation of Central Asia
Annual mean precipitation 2041-2070 (based on the averaged output of 7 GCM models under Greenhouse Gas Emission Scenario A2)
International Center for Agricultural Research in the Dry Areas (ICARDA)
2010
Tajikistan, Turkmenistan, Kazakhstan, Uzbekistan, Kyrgyzstan, Xingjiang Province
51.218469686
103.047567786
52.69812595
32.817056204
D_WGS_1984
WGS_1984
6378137.000000
298.257224
 Annual mean precipitation 2071-2100 A1b Scenario")
Central Asia and Xingjiang Province (China) Annual mean precipitation 2071-2100 A1b Scenario
Annual mean precipitation 2071-2100 (based on the averaged output of 7 GCM models under Greenhouse Gas Emission Scenario A1b)
Metadataclose[x]
Central Asia and Xingjiang Province (China) Annual mean precipitation 2071-2100 A1b Scenario
An input layer to create the map of Changes in Annual mean precipitation of Central Asia
Annual mean precipitation 2071-2100 (based on the averaged output of 7 GCM models under Greenhouse Gas Emission Scenario A1b)
International Center for Agricultural Research in the Dry Areas (ICARDA)
2010
Tajikistan, Turkmenistan, Kazakhstan, Uzbekistan, Kyrgyzstan, Xingjiang Province
51.218469686
103.047567786
52.69812595
32.817056204
D_WGS_1984
WGS_1984
6378137.000000
298.257224
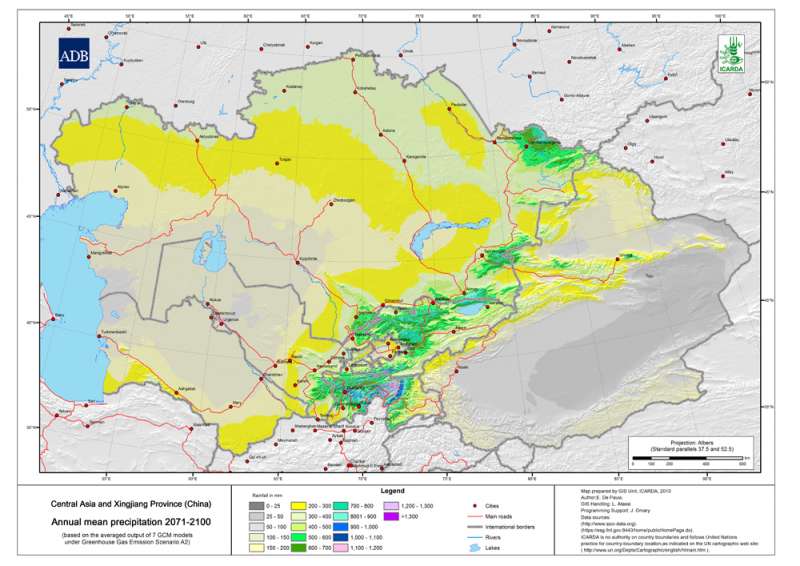
 Annual mean precipitation 2071-2100 A2 Scenario")
Central Asia and Xingjiang Province (China) Annual mean precipitation 2071-2100 A2 Scenario
Annual mean precipitation 2071-2100 (based on the averaged output of 7 GCM models under Greenhouse Gas Emission Scenario A2)
Metadataclose[x]
Central Asia and Xingjiang Province (China) Annual mean precipitation 2071-2100 A2 Scenario
An input layer to create the map of Changes in Annual mean precipitation of Central Asia
Annual mean precipitation 2071-2100 (based on the averaged output of 7 GCM models under Greenhouse Gas Emission Scenario A2)
International Center for Agricultural Research in the Dry Areas (ICARDA)
2010
Tajikistan, Turkmenistan, Kazakhstan, Uzbekistan, Kyrgyzstan, Xingjiang Province
51.218469686
103.047567786
52.69812595
32.817056204
D_WGS_1984
WGS_1984
6378137.000000
298.257224
 Annual mean precipitation Current")
Central Asia and Xingjiang Province (China) Annual mean precipitation Current
Mean annual precipitation grid for Central Asia and Xingjiang Province (China) at 30 arc-second ( about 1 km) resolution
Metadataclose[x]
Central Asia and Xingjiang Province (China) Annual mean precipitation Current
An input layer to create the map of agroclimatic zones and the map of the Changes in the Annual mean precipitation of Central Asia
Mean annual precipitation grid for Central Asia and Xingjiang Province (China) at 30 arc-second ( about 1 km) resolution
International Center for Agricultural Research in the Dry Areas (ICARDA)
2010
Tajikistan, Turkmenistan, Kazakhstan, Uzbekistan, Kyrgyzstan, Xingjiang Province
51.218469686
103.047567786
52.69812595
32.817056204
D_WGS_1984
WGS_1984
6378137.000000
298.257224
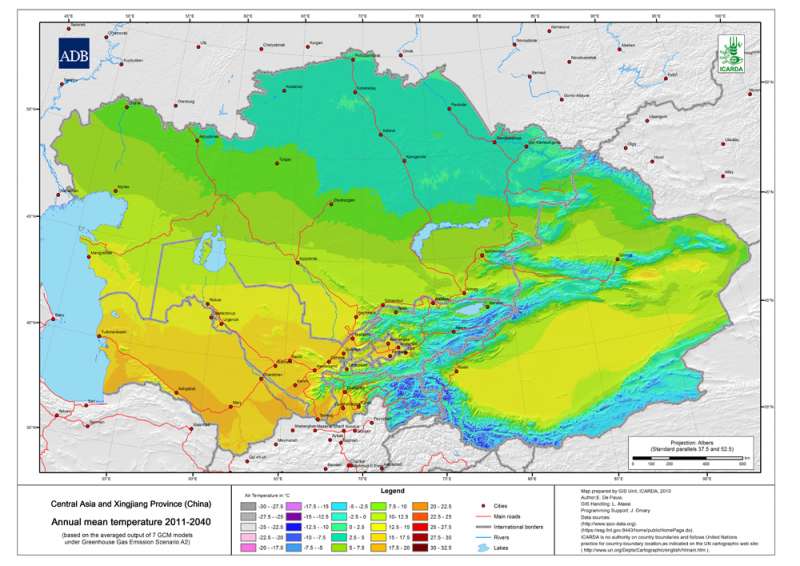
 Annual mean temperature 2011-2040 A1b Scenario")
Central Asia and Xingjiang Province (China) Annual mean temperature 2011-2040 A1b Scenario
Mean annual temperature 2011-2040 (based on the averaged output of 7 GCM models under Greenhouse Gas Emission Scenario A1b)
Metadataclose[x]
Central Asia and Xingjiang Province (China) Annual mean temperature 2011-2040 A1b Scenario
An input layer to create the map of Changes in Annual mean temperature of Central Asia
Mean annual temperature 2011-2040 (based on the averaged output of 7 GCM models under Greenhouse Gas Emission Scenario A1b)
International Center for Agricultural Research in the Dry Areas (ICARDA)
2010
Tajikistan, Turkmenistan, Kazakhstan, Uzbekistan, Kyrgyzstan, Xingjiang Province
51.218469686
103.047567786
52.69812595
32.817056204
D_WGS_1984
WGS_1984
6378137.000000
298.257224
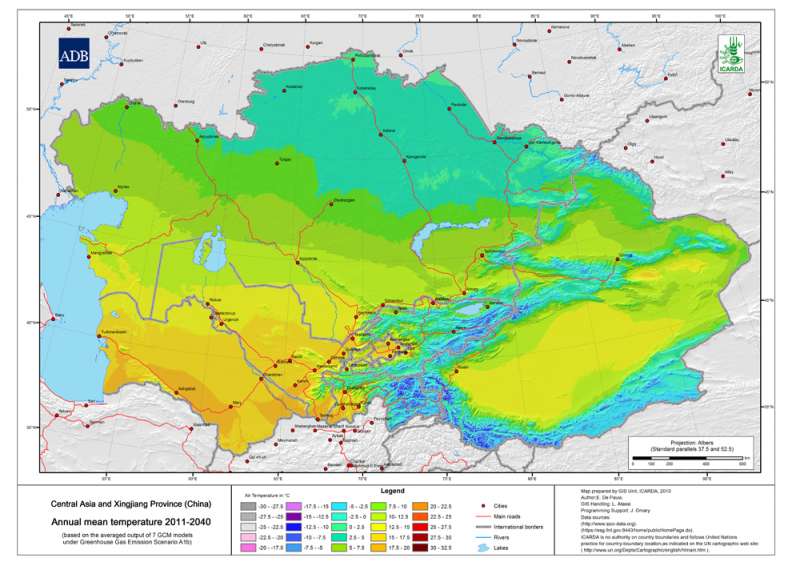
 Annual mean temperature 2011-2040 A2 Scenario")
Central Asia and Xingjiang Province (China) Annual mean temperature 2011-2040 A2 Scenario
Mean annual temperature 2011-2040 (based on the averaged output of 7 GCM models under Greenhouse Gas Emission Scenario A2)
Metadataclose[x]
Central Asia and Xingjiang Province (China) Annual mean temperature 2011-2040 A2 Scenario
An input layer to create the map of Changes in Annual mean temperature of Central Asia
Mean annual temperature 2011-2040 (based on the averaged output of 7 GCM models under Greenhouse Gas Emission Scenario A2)
International Center for Agricultural Research in the Dry Areas (ICARDA)
2010
Tajikistan, Turkmenistan, Kazakhstan, Uzbekistan, Kyrgyzstan, Xingjiang Province
51.218469686
103.047567786
52.69812595
32.817056204
D_WGS_1984
WGS_1984
6378137.000000
298.257224
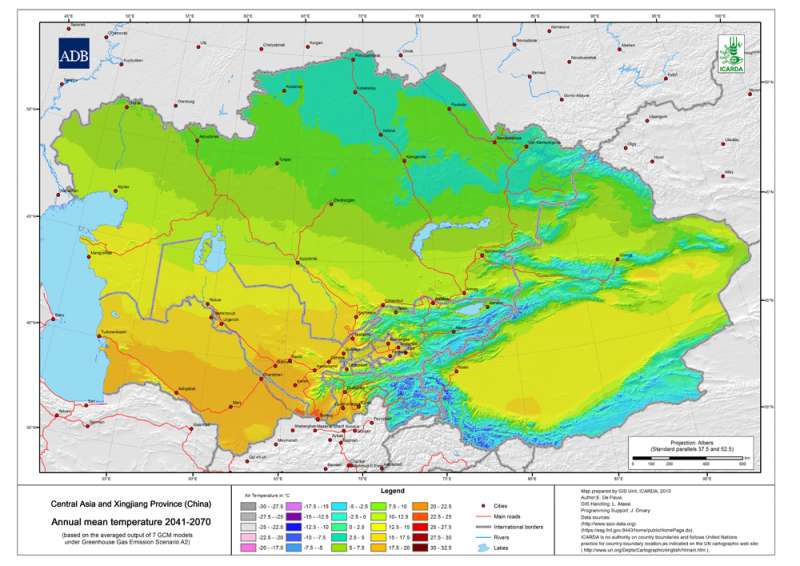
 Annual mean temperature 2041-2070 A1b Scenario")
Central Asia and Xingjiang Province (China) Annual mean temperature 2041-2070 A1b Scenario
Mean annual temperature 2041-2070 (based on the averaged output of 7 GCM models under Greenhouse Gas Emission Scenario A1b)
Metadataclose[x]
Central Asia and Xingjiang Province (China) Annual mean temperature 2041-2070 A1b Scenario
An input layer to create the map of Changes in Annual mean temperature of Central Asia
Mean annual temperature 2041-2070 (based on the averaged output of 7 GCM models under Greenhouse Gas Emission Scenario A1b)
International Center for Agricultural Research in the Dry Areas (ICARDA)
2010
Tajikistan, Turkmenistan, Kazakhstan, Uzbekistan, Kyrgyzstan, Xingjiang Province
51.218469686
103.047567786
52.69812595
32.817056204
D_WGS_1984
WGS_1984
6378137.000000
298.257224
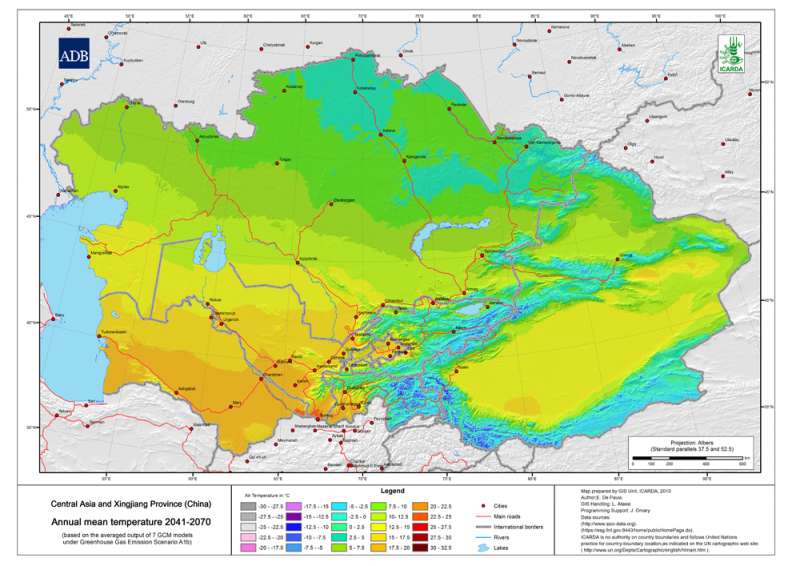
 Annual mean temperature 2041-2070 A2 Scenario")
Central Asia and Xingjiang Province (China) Annual mean temperature 2041-2070 A2 Scenario
Mean annual temperature 2041-2070 (based on the averaged output of 7 GCM models under Greenhouse Gas Emission Scenario A2)
Metadataclose[x]
Central Asia and Xingjiang Province (China) Annual mean temperature 2041-2070 A2 Scenario
An input layer to create the map of Changes in Annual mean temperature of Central Asia
Mean annual temperature 2041-2070 (based on the averaged output of 7 GCM models under Greenhouse Gas Emission Scenario A2)
International Center for Agricultural Research in the Dry Areas (ICARDA)
2010
Tajikistan, Turkmenistan, Kazakhstan, Uzbekistan, Kyrgyzstan, Xingjiang Province
51.218469686
103.047567786
52.69812595
32.817056204
D_WGS_1984
WGS_1984
6378137.000000
298.257224
 Annual mean temperature 2071-2100 A1b Scenario")
Central Asia and Xingjiang Province (China) Annual mean temperature 2071-2100 A1b Scenario
Mean annual temperature 2071-2100 (based on the averaged output of 7 GCM models under Greenhouse Gas Emission Scenario A1b)
Metadataclose[x]
Central Asia and Xingjiang Province (China) Annual mean temperature 2071-2100 A1b Scenario
An input layer to create the map of Changes in Annual mean temperature of Central Asia
Mean annual temperature 2071-2100 (based on the averaged output of 7 GCM models under Greenhouse Gas Emission Scenario A1b)
International Center for Agricultural Research in the Dry Areas (ICARDA)
2010
Tajikistan, Turkmenistan, Kazakhstan, Uzbekistan, Kyrgyzstan, Xingjiang Province
51.218469686
103.047567786
52.69812595
32.817056204
D_WGS_1984
WGS_1984
6378137.000000
298.257224
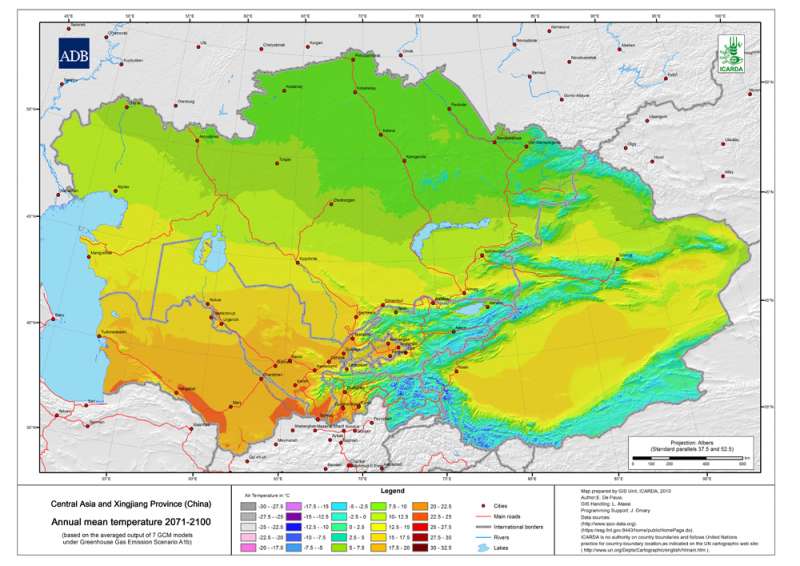
 Annual mean temperature 2071-2100 A2 Scenario")
Central Asia and Xingjiang Province (China) Annual mean temperature 2071-2100 A2 Scenario
Mean annual temperature 2071-2100 (based on the averaged output of 7 GCM models under Greenhouse Gas Emission Scenario A2)
Metadataclose[x]
Central Asia and Xingjiang Province (China) Annual mean temperature 2071-2100 A2 Scenario
An input layer to create the map of Changes in Annual mean temperature of Central Asia
Mean annual temperature 2071-2100 (based on the averaged output of 7 GCM models under Greenhouse Gas Emission Scenario A2)
International Center for Agricultural Research in the Dry Areas (ICARDA)
2010
Tajikistan, Turkmenistan, Kazakhstan, Uzbekistan, Kyrgyzstan, Xingjiang Province
51.218469686
103.047567786
52.69812595
32.817056204
D_WGS_1984
WGS_1984
6378137.000000
298.257224
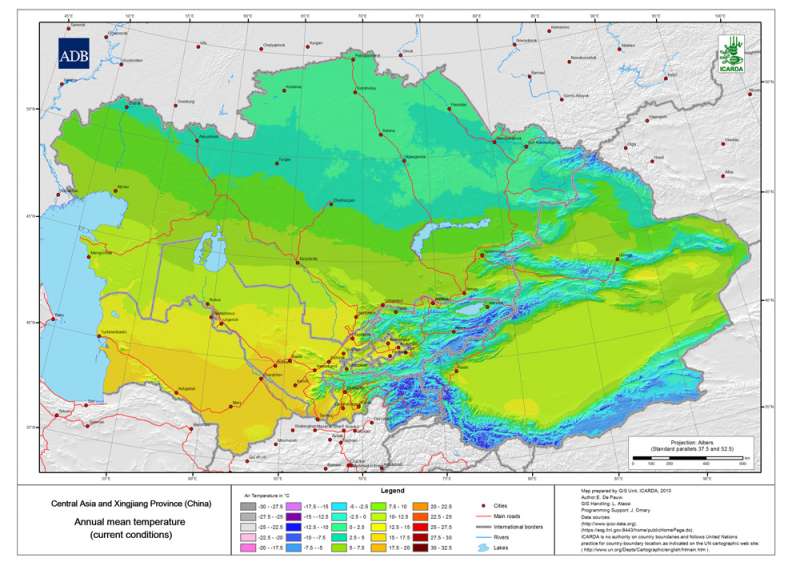
 Annual mean temperature Current")
Central Asia and Xingjiang Province (China) Annual mean temperature Current
Mean annual temperature grid for Central Asia and Xingjiang Province (China) at 30 arc-second ( about 1 km) resolution
Metadataclose[x]
Central Asia and Xingjiang Province (China) Annual mean temperature Current
An input layer to create the map of agroclimatic zones and the map of the Changes in Annual mean temperature of Central Asia
Mean annual temperature grid for Central Asia and Xingjiang Province (China) at 30 arc-second ( about 1 km) resolution
International Center for Agricultural Research in the Dry Areas (ICARDA)
2010
Tajikistan, Turkmenistan, Kazakhstan, Uzbekistan, Kyrgyzstan, Xingjiang Province
51.218469686
103.047567786
52.69812595
32.817056204
D_WGS_1984
WGS_1984
6378137.000000
298.257224
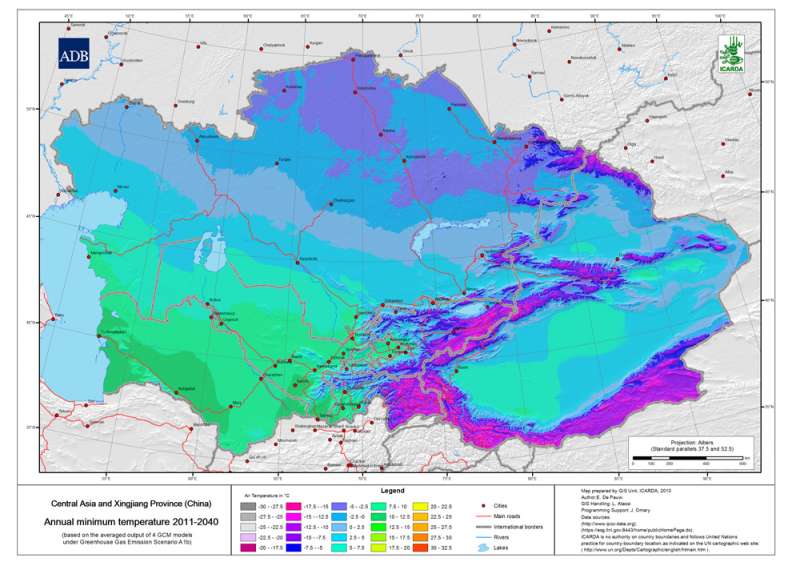
 Annual minimum temperature 2011-2040 A1b Scenario")
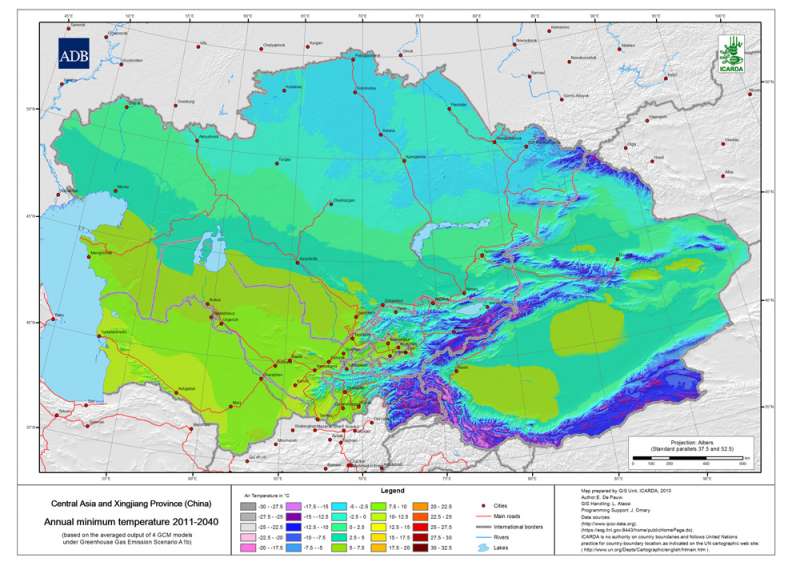
Central Asia and Xingjiang Province (China) Annual minimum temperature 2011-2040 A1b Scenario
Mean annual minimum temperature 2011-2040 (based on the averaged output of 7 GCM models under Greenhouse Gas Emission Scenario A1b)
Metadataclose[x]
Central Asia and Xingjiang Province (China) Annual minimum temperature 2011-2040 A1b Scenario
An input layer to create the map of the Changes in the Annual minimum temperature of Central Asia
Mean annual minimum temperature 2011-2040 (based on the averaged output of 7 GCM models under Greenhouse Gas Emission Scenario A1b)
International Center for Agricultural Research in the Dry Areas (ICARDA)
2010
Tajikistan, Turkmenistan, Kazakhstan, Uzbekistan, Kyrgyzstan, Xingjiang Province
51.218469686
103.047567786
52.69812595
32.817056204
D_WGS_1984
WGS_1984
6378137.000000
298.257224
 Annual minimum temperature 2011-2040 A2 Scenario")
Central Asia and Xingjiang Province (China) Annual minimum temperature 2011-2040 A2 Scenario
Mean annual minimumtemperature 2011-2040 (based on the averaged output of 7 GCM models under Greenhouse Gas Emission Scenario A2)
Metadataclose[x]
Central Asia and Xingjiang Province (China) Annual minimum temperature 2011-2040 A2 Scenario
An input layer to create the map of the Changes in the Annual minimum temperature of Central Asia
Mean annual minimumtemperature 2011-2040 (based on the averaged output of 7 GCM models under Greenhouse Gas Emission Scenario A2)
International Center for Agricultural Research in the Dry Areas (ICARDA)
2010
Tajikistan, Turkmenistan, Kazakhstan, Uzbekistan, Kyrgyzstan, Xingjiang Province
51.218469686
103.047567786
52.69812595
32.817056204
D_WGS_1984
WGS_1984
6378137.000000
298.257224
 Annual minimum temperature 2041-2070 A1b Scenario")
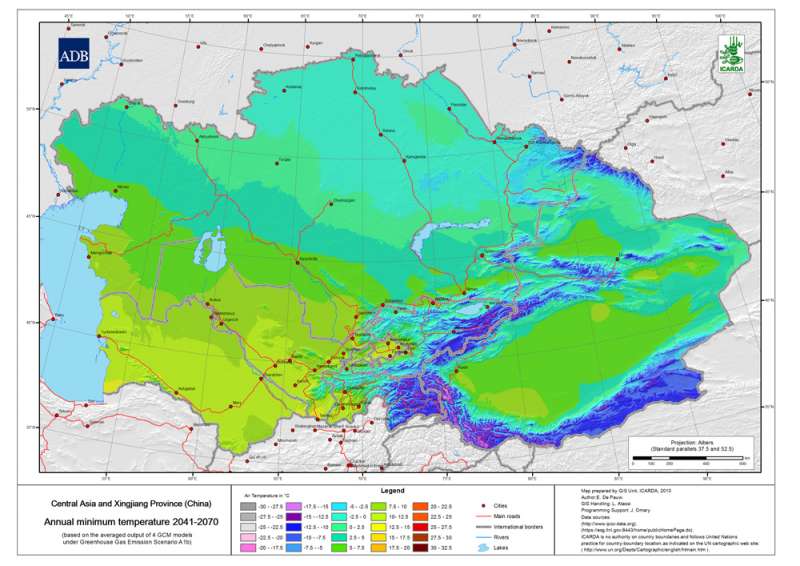
Central Asia and Xingjiang Province (China) Annual minimum temperature 2041-2070 A1b Scenario
Mean annual minimumtemperature 2041-2070 (based on the averaged output of 7 GCM models under Greenhouse Gas Emission Scenario A1b)
Metadataclose[x]
Central Asia and Xingjiang Province (China) Annual minimum temperature 2041-2070 A1b Scenario
An input layer to create the map of the Changes in the Annual minimum temperature of Central Asia
Mean annual minimumtemperature 2041-2070 (based on the averaged output of 7 GCM models under Greenhouse Gas Emission Scenario A1b)
International Center for Agricultural Research in the Dry Areas (ICARDA)
2010
Tajikistan, Turkmenistan, Kazakhstan, Uzbekistan, Kyrgyzstan, Xingjiang Province
51.218469686
103.047567786
52.69812595
32.817056204
D_WGS_1984
WGS_1984
6378137.000000
298.257224
 Annual minimum temperature 2041-2070 A2 Scenario")
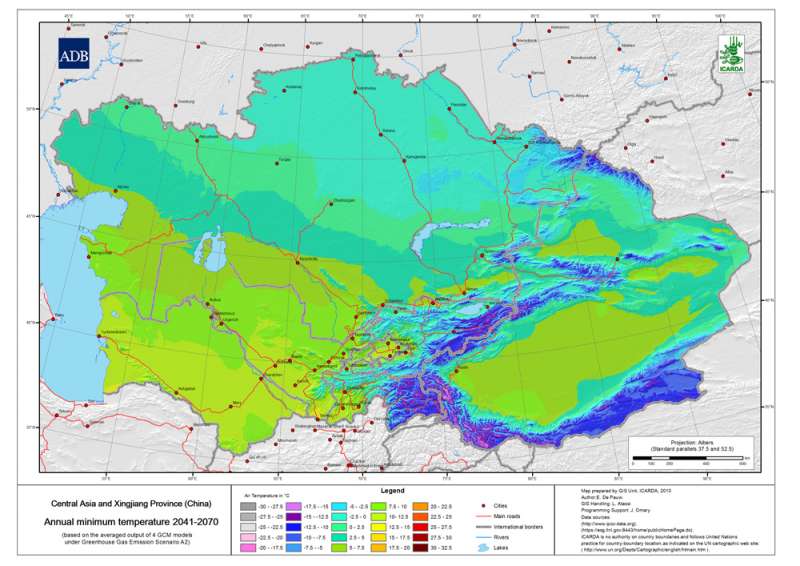
Central Asia and Xingjiang Province (China) Annual minimum temperature 2041-2070 A2 Scenario
Mean annual minimumtemperature 2041-2070 (based on the averaged output of 7 GCM models under Greenhouse Gas Emission Scenario A2)
Metadataclose[x]
Central Asia and Xingjiang Province (China) Annual minimum temperature 2041-2070 A2 Scenario
An input layer to create the map of the Changes in the Annual minimum temperature of Central Asia
Mean annual minimumtemperature 2041-2070 (based on the averaged output of 7 GCM models under Greenhouse Gas Emission Scenario A2)
International Center for Agricultural Research in the Dry Areas (ICARDA)
2010
Tajikistan, Turkmenistan, Kazakhstan, Uzbekistan, Kyrgyzstan, Xingjiang Province
51.218469686
103.047567786
52.69812595
32.817056204
D_WGS_1984
WGS_1984
6378137.000000
298.257224
 Annual minimum temperature 2071-2100 A1b Scenario")
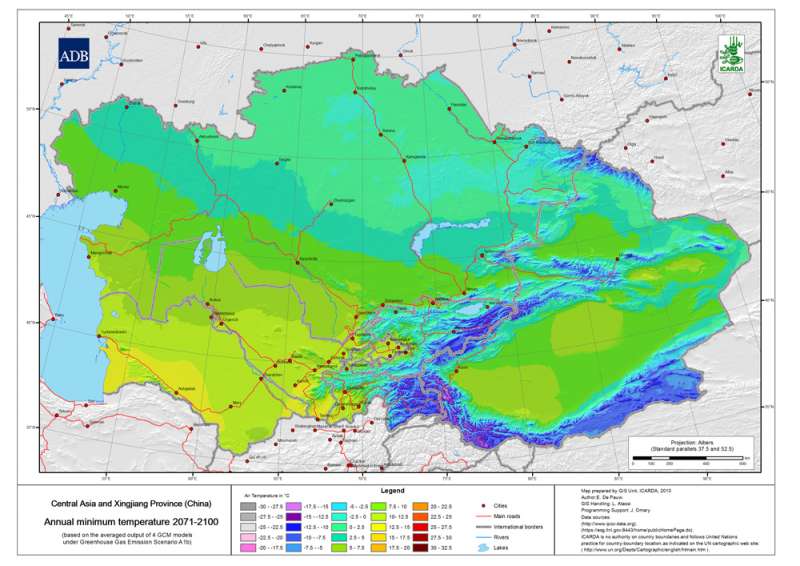
Central Asia and Xingjiang Province (China) Annual minimum temperature 2071-2100 A1b Scenario
Mean annual minimumtemperature 2071-2100 (based on the averaged output of 7 GCM models under Greenhouse Gas Emission Scenario A1b)
Metadataclose[x]
Central Asia and Xingjiang Province (China) Annual minimum temperature 2071-2100 A1b Scenario
An input layer to create the map of the Changes in the Annual minimum temperature of Central Asia
Mean annual minimumtemperature 2071-2100 (based on the averaged output of 7 GCM models under Greenhouse Gas Emission Scenario A1b)
International Center for Agricultural Research in the Dry Areas (ICARDA)
2010
Tajikistan, Turkmenistan, Kazakhstan, Uzbekistan, Kyrgyzstan, Xingjiang Province
51.218469686
103.047567786
52.69812595
32.817056204
D_WGS_1984
WGS_1984
6378137.000000
298.257224
 Annual minimum temperature 2071-2100 A2 Scenario")
Central Asia and Xingjiang Province (China) Annual minimum temperature 2071-2100 A2 Scenario
Mean annual minimumtemperature 2071-2100 (based on the averaged output of 7 GCM models under Greenhouse Gas Emission Scenario A2)
Metadataclose[x]
Central Asia and Xingjiang Province (China) Annual minimum temperature 2071-2100 A2 Scenario
An input layer to create the map of the Changes in the Annual minimum temperature of Central Asia
Mean annual minimumtemperature 2071-2100 (based on the averaged output of 7 GCM models under Greenhouse Gas Emission Scenario A2)
International Center for Agricultural Research in the Dry Areas (ICARDA)
2010
Tajikistan, Turkmenistan, Kazakhstan, Uzbekistan, Kyrgyzstan, Xingjiang Province
51.218469686
103.047567786
52.69812595
32.817056204
D_WGS_1984
WGS_1984
6378137.000000
298.257224
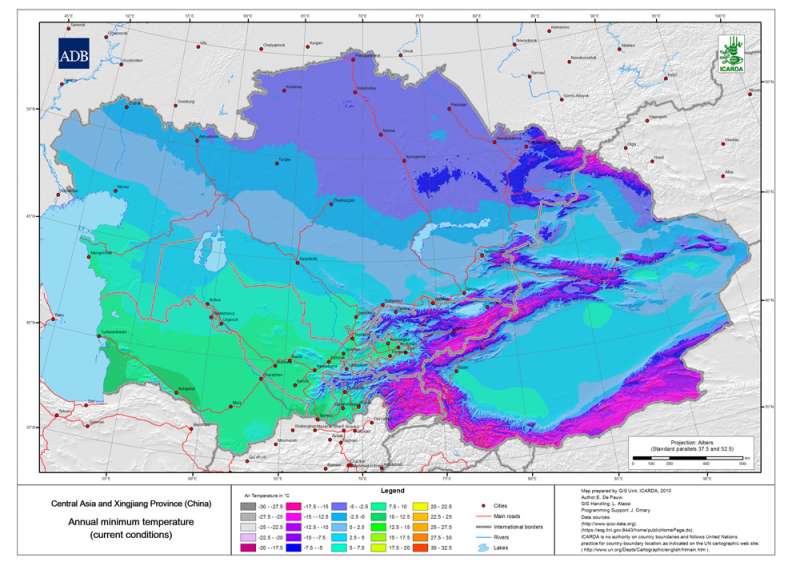
 Annual minimum temperature Current")
Central Asia and Xingjiang Province (China) Annual minimum temperature Current
Mean annual Temperature of the coldest month for Central Asia and Xingjiang Province (China) at 30 arc-second ( about 1 km) resolution
Metadataclose[x]
Central Asia and Xingjiang Province (China) Annual minimum temperature Current
An input layer to create the map of agroclimatic zones and the map of the Changes in Annual mean temperature of Central Asia
Mean annual Temperature of the coldest month for Central Asia and Xingjiang Province (China) at 30 arc-second ( about 1 km) resolution
International Center for Agricultural Research in the Dry Areas (ICARDA)
2010
Tajikistan, Turkmenistan, Kazakhstan, Uzbekistan, Kyrgyzstan, Xingjiang Province
51.218469686
103.047567786
52.69812595
32.817056204
D_WGS_1984
WGS_1984
6378137.000000
298.257224