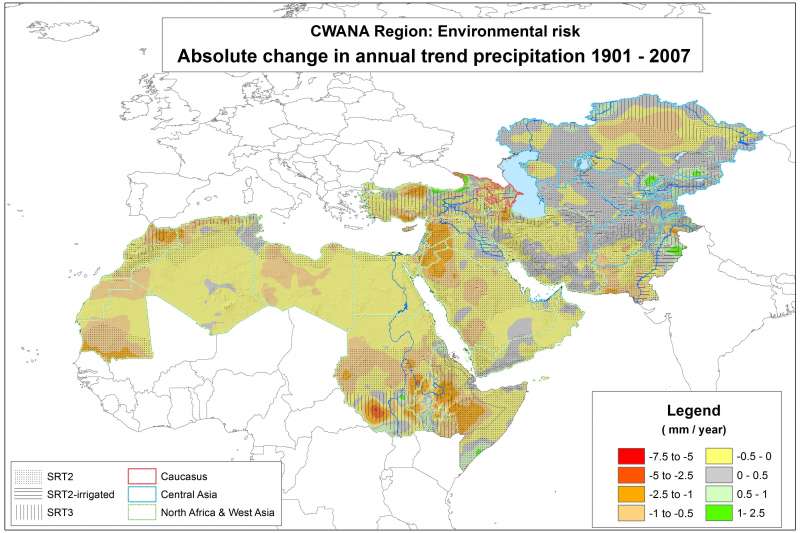
This map is based on the Full Data Reanalysis Product Version 4 of the Global Precipitation Climatology Centre (GPCC). It has been obtained by linear regression fitted to the 107-year time series of annual precipitation of each 0.5x0.5 degree grid cell by the least-squares method and subsequent resampling to 0.008333 degree (about 1 km) spatial resolution. The map shows the average absolute change in mm/year as measured along the trend line between 1901 and 2007. With some exceptions (e.g. parts of the Black Sea coast and the rim of Central Asia mountains) the trend is negative in most of the region.
This map is based on the Full Data Reanalysis Product Version 4 of the Global Precipitation Climatology Centre (GPCC). It has been obtained by linear regression fitted to the 107-year time series of annual precipitation of each 0.5x0.5 degree grid cell by the least-squares method and subsequent resampling to 0.008333 degree (about 1 km) spatial resolution. The map shows the average absolute change in mm/year as measured along the trend line between 1901 and 2007. With some exceptions (e.g. parts of the Black Sea coast and the rim of Central Asia mountains) the trend is negative in most of the region.


