


Geoinformatics Solutions for Integrated Agro-ecosystems Research
GIS Data
Global - Climate
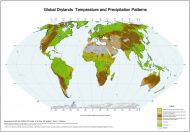
Global Drylands: Temperature and Precipitation Patterns
The drylands of the world show great diversity in their temperature characteristics and precipitation patterns. This map captures this diversity in a limited number of classes with the following characteristics:
NON-TROPICAL DRYLANDS
- Cold (< 10° C) to mild winters (10-20° C);
- Mild (10-20° C) to very warm (> 30° C) summers.;
- Moisture regime ranging from arid to semi-arid to sub-humid;
- Variable precipitation patterns;
- Cold is a general but variable constraint, depending on severity of the winters, requiring adaptation of plants and crops;
- Agricultural systems are dominated by non-tropical crops with low water requirements (wheat, barley)
With winter-rainfall patterns
Water needs of crops are lower as compared to tropical areas, therefore higher water use efficiency. C3-crops have a productivity advantage.
With summer rainfall patterns
Water needs of crops are higher than in winter rainfall patterns, but usually lower than in tropical areas. C3-crops adapted to higher temperatures, or C4-crops adapted to lower temperatures, have a productivity advantage.
With transitional rainfall patterns:
Regimes with two rainy seasons, in summer and in winter, or with irregular unpredictable patterns.
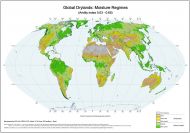
Global Drylands: Moisture Regimes
The general moisture regime of the drylands of the world can be expressed by a simple measure, the aridity index (ratio annual precipitation to annual potential evapotranspiration). The following classes are shown on this map:
Hyper-arid: aridity index <0.03
Characterized by very low and irregular rain, which may fall in any season
Arid: aridity index 0.03 – <0.2
Characterized by annual rainfall of 80-200 mm (in areas with winter rainfall) up to 200-350 mm (in areas with summer rainfall). Inter-annual rainfall variability 50-100 percent
Semi-arid: aridity index 0.2 – <0.5
In winter rainfall areas: mean annual rainfall from 200-250 mm to 450-500 mm.
In summer rainfall areas: mean annual rainfall from 300-400 mm to 700-800 mm
Inter-annual rainfall variability 25-50 percent
Sub-humid: aridity index 0.5 – <0.65. Inter-annual rainfall variability is less than 25 percent
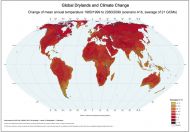
Global Drylands and Climate Change: Change of mean annual temperature 1980/1999 to 2080/2099
This map visualizes what climate change actually means in terms of temperature changes in different parts of the globe over a 100-year period (from 1980/89 to 2080/99) under the greenhouse gas emission scenario A1b (see further). With respect to the global drylands, the following table summarizes these changes by relating different dryland regions to temperature change classes.
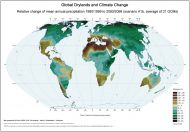
Global Drylands and Climate Change: Relative change of mean annual precipitation 1980/1999 to 2080/2099
This map visualizes what climate change actually means in terms of precipitation changes in different parts of the globe over a 100-year period (from 1980/89 to 2080/99) under the greenhouse gas emission scenario A1b (see further). With respect to the global drylands, the following table summarizes these changes by relating different dryland regions to precipitation change classes.
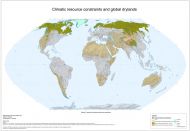
Climatic resource constraints and global drylands
Drylands are usually associated with ‘hot’ areas but can in fact be affected by both severe moisture shortage and low temperature.
A severe moisture constraint is defined as where the aridity index is below 0.35.
A severe coldness constraint is defined where the annual sum of growing degree days (above 0°C) is less than 2000.
This simple map shows areas where such constraints occur either single or combined.