


Geoinformatics Solutions for Integrated Agro-ecosystems Research
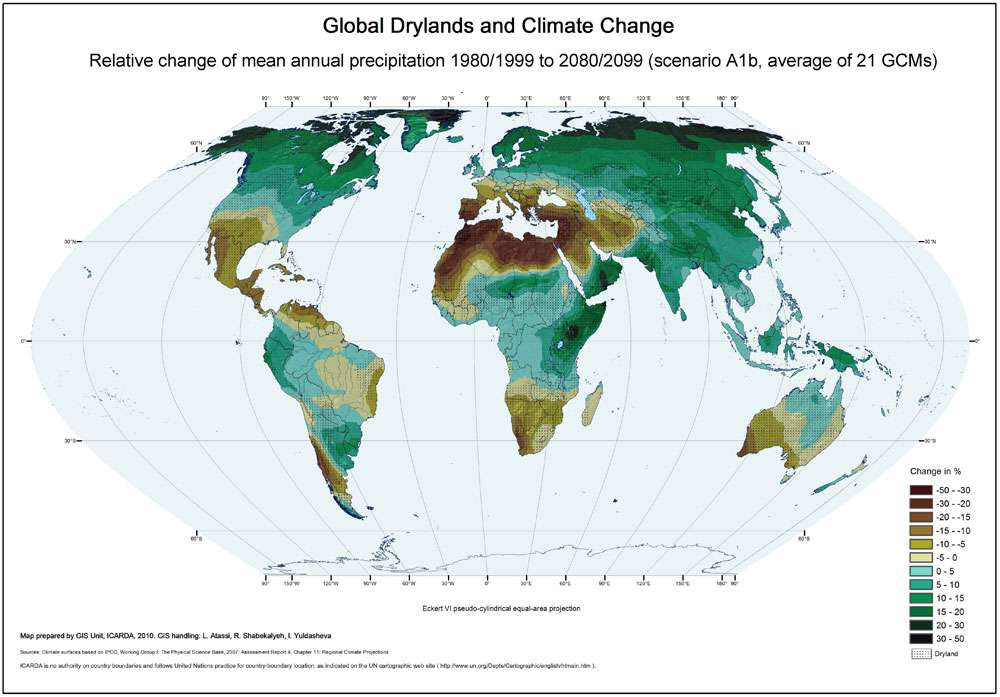
Global Drylands and Climate Change: Relative change of mean annual precipitation 1980/1999 to 2080/2099
This map visualizes what climate change actually means in terms of precipitation changes in different parts of the globe over a 100-year period (from 1980/89 to 2080/99) under the greenhouse gas emission scenario A1b (see further). With respect to the global drylands, the following table summarizes these changes by relating different dryland regions to precipitation change classes.
Authors:
W. Göbel , E. De Pauw
Institute:
ICARDA GIS unit
Decription:
This map visualizes what climate change actually means in terms of precipitation changes in different parts of the globe over a 100-year period (from 1980/89 to 2080/99) under the greenhouse gas emission scenario A1b (see further). With respect to the global drylands, the following table summarizes these changes by relating different dryland regions to precipitation change classes.
Table. Changes (%) in annual precipitation for different dryland types (from 1980/89 to 2080/99, scenario A1b).
|
Dryland category |
-50 to -30 |
-30 to -20 |
-20 to -10 |
-10 to 0 |
0 to 10 |
10 to 20 |
20 to 30 |
30 to 50 |
Loss |
Gain |
|
Non-tropical drylands |
0 |
4 |
12 |
32 |
32 |
19 |
0 |
0 |
48 |
52 |
|
Tropical drylands |
0 |
0 |
6 |
21 |
51 |
19 |
2 |
0 |
27 |
73 |
|
True deserts |
0 |
31 |
23 |
18 |
17 |
10 |
1 |
0 |
72 |
28 |
|
Non- drylands |
0 |
0 |
2 |
10 |
27 |
39 |
17 |
4 |
13 |
87 |
The changes in precipitation totals show some extremes, with a clear tendency towards increase in the non-drylands and tropical drylands, and a mixed pattern of increase or decrease in the non-tropical drylands.
The A1b greenhouse gas emission scenario assumes a balance between fossil-intensive and non-fossil energy sources, where balance is defined as not relying too heavily on one particular energy source, on the assumption that similar improvement rates apply to all energy supply and end use technologies. It is currently considered an optimistic scenario.
Source Data:
Christensen, J.H., Hewitson, B., Busuioc, A., Chen, A., Gao, X., Held, I., Jones, R., Kolli, R.K., Kwon, W.-T.,Laprise, R., Magaña Rueda, V., Mearns, L., Menéndez, C.G., Räisänen, J., Rinke, A., Sarr, A. and Whetton, P.(2007) In: Solomon, S. , Qin, D., Manning, M., Chen,Z., Marquis, M., Averyt, K.B. , M. Tignor, M., and Miller, H.L. (eds.) Regional Climate Projections. Climate Change 2007: The Physical Science Basis. Contribution of Working Group I to the Fourth Assessment Report of the Intergovernmental Panel on Climate Change.
Messageclose[x]
Message Body Goes Here