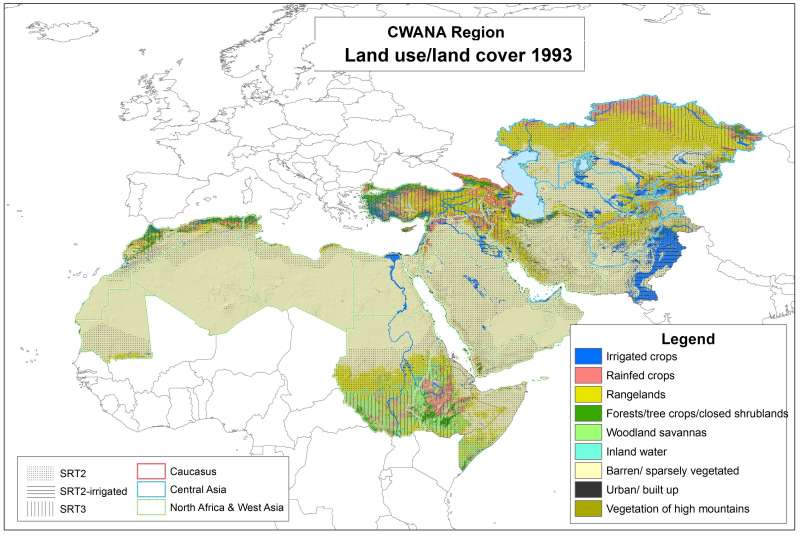
This map shows an 8-class land use/land cover map, compiled by aggregation of an initial 12-class land use/land cover classification based on image analysis of AVHRR data at 1-km spatial resolution for the period April 1992 to March 1993. The main approach used for building up the classification was a hierarchical decision-tree with sliding thresholds for the annual minimum, maximum and mean NDVI, which varied according to the agroclimatic zone.
This map shows an 8-class land use/land cover map, compiled by aggregation of an initial 12-class land use/land cover classification based on image analysis of AVHRR data at 1-km spatial resolution for the period April 1992 to March 1993. The main approach used for building up the classification was a hierarchical decision-tree with sliding thresholds for the annual minimum, maximum and mean NDVI, which varied according to the agroclimatic zone.


