


Geoinformatics Solutions for Integrated Agro-ecosystems Research
GIS Data
Maps in: South Asia


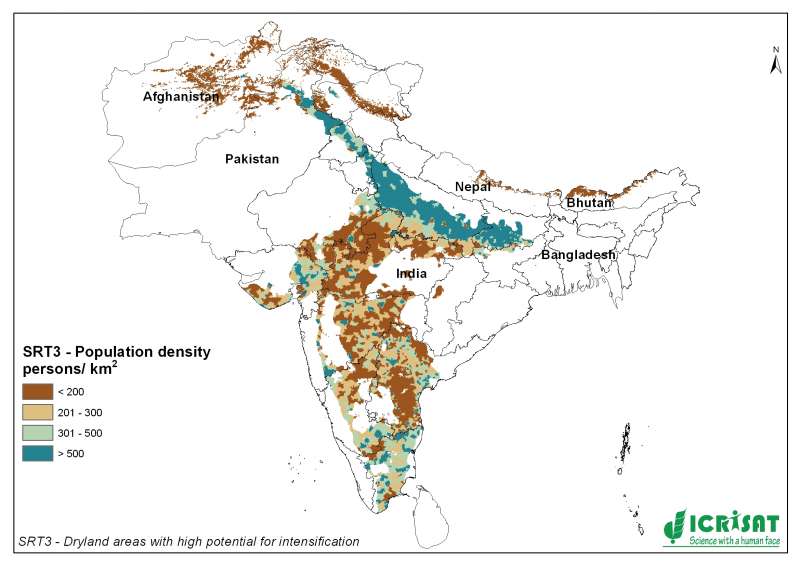
SRT3-type drylands: population density
Gridded Population of the World, version 3 (GPWv3)
Center for International Earth Science Information Network (CIESIN), Columbia University; and Centro Internacional de Agricultura Tropical (CIAT). 2005. Gridded Population of the World Version 3 (GPWv3). Palisades, NY: Socioeconomic Data and Applications Center (SEDAC), Columbia University. Available at http://sedac.ciesin.columbia.edu/gpw.
Population Density Grids
Center for International Earth Science Information Network (CIESIN), Columbia University; and Centro Internacional de Agricultura Tropical (CIAT). 2005. Gridded Population of the World Version 3 (GPWv3): Population Density Grids. Palisades, NY: Socioeconomic Data and Applications Center (SEDAC), Columbia University. Available at http://sedac.ciesin.columbia.edu/gpw.
Metadataclose[x]
SRT3-type drylands: population density
Gridded Population of the World, version 3 (GPWv3)
Center for International Earth Science Information Network (CIESIN), Columbia University; and Centro Internacional de Agricultura Tropical (CIAT). 2005. Gridded Population of the World Version 3 (GPWv3). Palisades, NY: Socioeconomic Data and Applications Center (SEDAC), Columbia University. Available at http://sedac.ciesin.columbia.edu/gpw.
Population Density Grids
Center for International Earth Science Information Network (CIESIN), Columbia University; and Centro Internacional de Agricultura Tropical (CIAT). 2005. Gridded Population of the World Version 3 (GPWv3): Population Density Grids. Palisades, NY: Socioeconomic Data and Applications Center (SEDAC), Columbia University. Available at http://sedac.ciesin.columbia.edu/gpw.

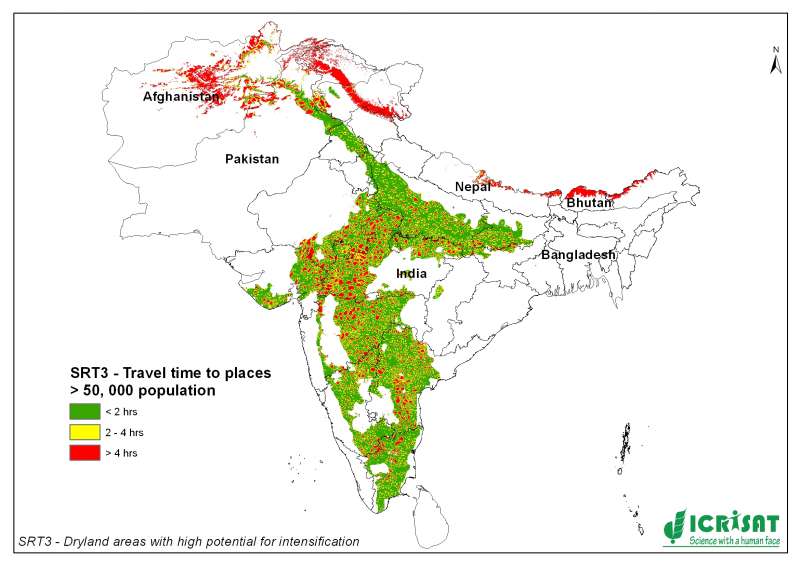
SRT3-type drylands: market access
This map was made for the World Bank's World Development Report
2009 Reshaping Economic Geography. The message of
the report can be summarised as:
Uchida, H. and Nelson, A. Agglomeration Index: Towards a New Measure of Urban Concentration. Background paper for the World Bank’s World Development Report 2009.
Uchida, H. and Nelson, A. (accepted) Agglomeration Index: Towards a New Measure of Urban Concentration. In: Guha-Khasnobis, B. (Ed), Development in an Urban World, UNU-WIDER
Metadataclose[x]
SRT3-type drylands: market access
This map was made for the World Bank's World Development Report
2009 Reshaping Economic Geography. The message of
the report can be summarised as:
Uchida, H. and Nelson, A. Agglomeration Index: Towards a New Measure of Urban Concentration. Background paper for the World Bank’s World Development Report 2009.
Uchida, H. and Nelson, A. (accepted) Agglomeration Index: Towards a New Measure of Urban Concentration. In: Guha-Khasnobis, B. (Ed), Development in an Urban World, UNU-WIDER

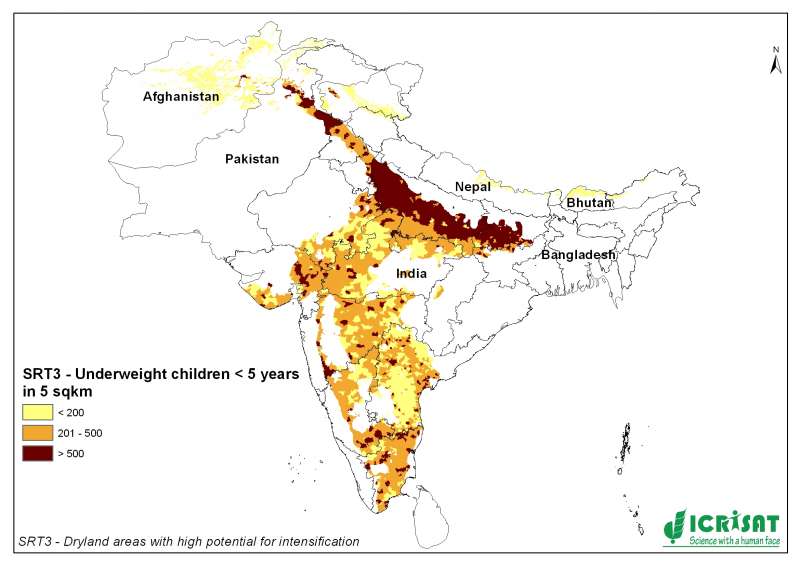
SRT3-type drylands: malnutrition/stunting data
Publication Date: 2005
Title: Poverty Mapping Project: Global Subnational Prevalence of Child Malnutrition
Geospatial Data Presentation Form: raster digital data, vector digital data, tabular digital data, map
Publication Information:
Publisher: CIESIN, Columbia University
Metadataclose[x]
SRT3-type drylands: malnutrition/stunting data
Publication Date: 2005
Title: Poverty Mapping Project: Global Subnational Prevalence of Child Malnutrition
Geospatial Data Presentation Form: raster digital data, vector digital data, tabular digital data, map
Publication Information:
Publisher: CIESIN, Columbia University

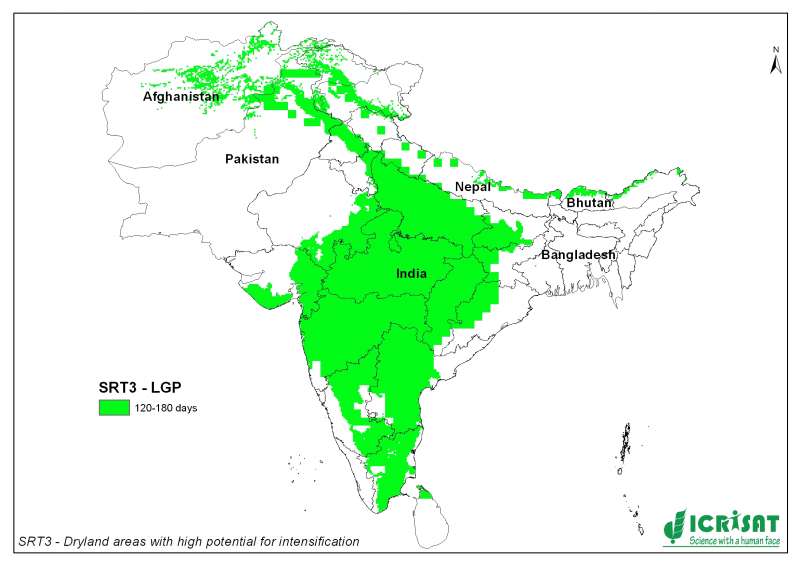
SRT3-type drylands: length of growing period
This is the period during the year when both moisture availability and temperature are conducive to crop growth. Thus, in a formal sense, LGP refers to the number of days within LGPwhen moisture conditions are considered adequate.
Metadataclose[x]
SRT3-type drylands: length of growing period
This is the period during the year when both moisture availability and temperature are conducive to crop growth. Thus, in a formal sense, LGP refers to the number of days within LGPwhen moisture conditions are considered adequate.

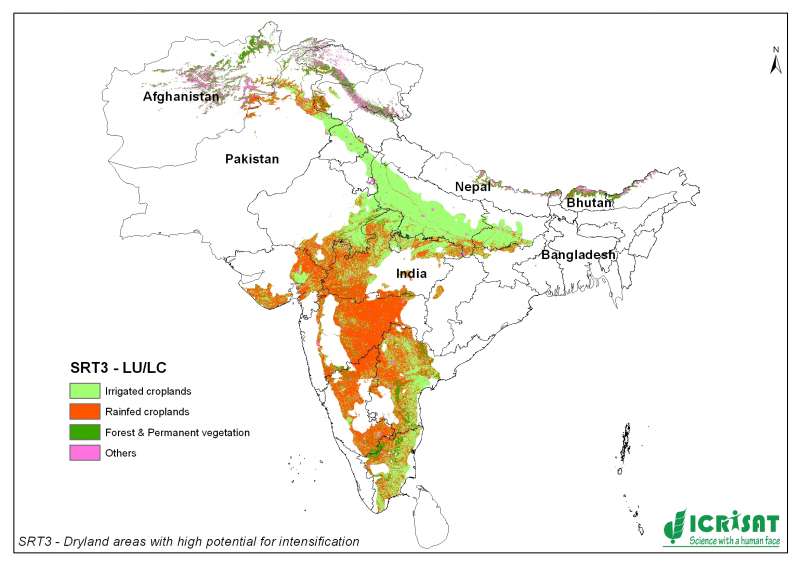
SRT3-type drylands: land use/land cover
Overview
The GLOBCOVER project was launched 2004 as an initiative of ESA which is now evolving to an international collaboration between ESA, FAO, UNEP, JRC, IGBP and GOFC-GOLD. The objective of GLOBCOVER is to produce a global land-cover map for the year 2005, using as main source of data the fine resolution (300 m) mode data from MERIS sensor on-board ENVISAT satellite, acquired over the full year 2005. This new product intends to complement and update other existing comparable global products, such as the global land cover map for the year 2000 (GLC 2000) with a resolution of 1 km produced by the JRC. Appropriate approaches for the validation of the land cover products are planned to be defined in consultation with CEOS.
Metadataclose[x]
SRT3-type drylands: land use/land cover
Overview
The GLOBCOVER project was launched 2004 as an initiative of ESA which is now evolving to an international collaboration between ESA, FAO, UNEP, JRC, IGBP and GOFC-GOLD. The objective of GLOBCOVER is to produce a global land-cover map for the year 2005, using as main source of data the fine resolution (300 m) mode data from MERIS sensor on-board ENVISAT satellite, acquired over the full year 2005. This new product intends to complement and update other existing comparable global products, such as the global land cover map for the year 2000 (GLC 2000) with a resolution of 1 km produced by the JRC. Appropriate approaches for the validation of the land cover products are planned to be defined in consultation with CEOS.

SRT3-type drylands: land degradation
Metadataclose[x]
SRT3-type drylands: land degradation

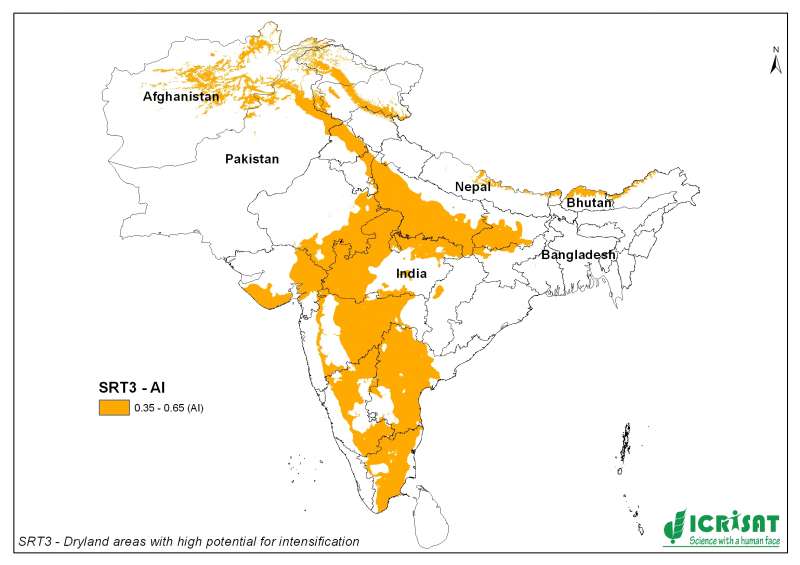
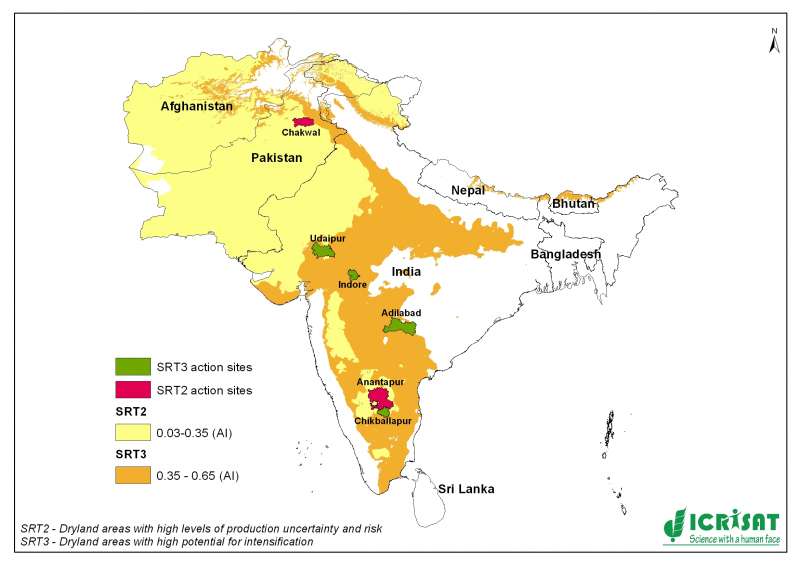
SRT3-type drylands: aridity index
| Value | Climate Class |
|
<
0.03 |
Hyper Arid |
|
0.03 –
0.2 |
Arid |
|
0.2 –
0.5 |
Semi-Arid |
|
0.5 –
0.65 |
Dry sub-humid |
|
> 0.65
|
Humid |
Metadataclose[x]
SRT3-type drylands: aridity index
| Value | Climate Class |
|
<
0.03 |
Hyper Arid |
|
0.03 –
0.2 |
Arid |
|
0.2 –
0.5 |
Semi-Arid |
|
0.5 –
0.65 |
Dry sub-humid |
|
> 0.65
|
Humid |


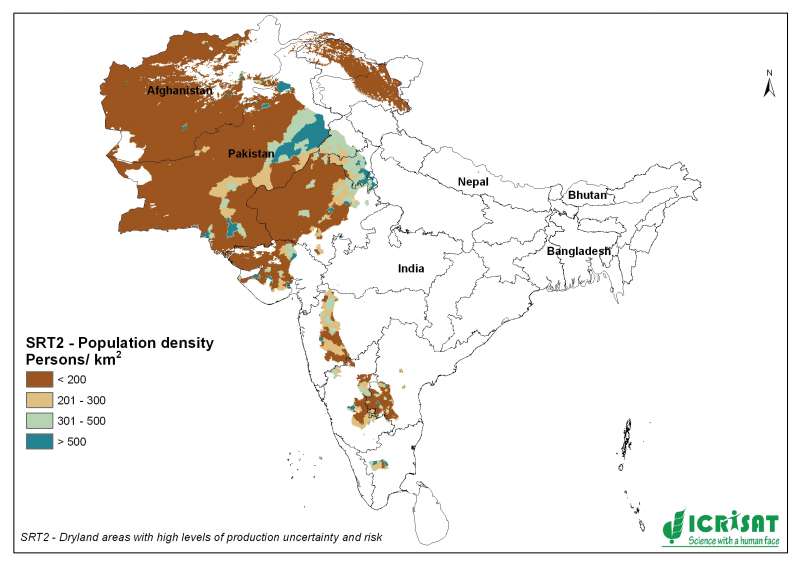
SRT2-type drylands: population density
Gridded Population of the World, version 3 (GPWv3)
Center for International Earth Science Information Network (CIESIN), Columbia University; and Centro Internacional de Agricultura Tropical (CIAT). 2005. Gridded Population of the World Version 3 (GPWv3). Palisades, NY: Socioeconomic Data and Applications Center (SEDAC), Columbia University. Available at http://sedac.ciesin.columbia.edu/gpw.
Population Density Grids
Center for International Earth Science Information Network (CIESIN), Columbia University; and Centro Internacional de Agricultura Tropical (CIAT). 2005. Gridded Population of the World Version 3 (GPWv3): Population Density Grids. Palisades, NY: Socioeconomic Data and Applications Center (SEDAC), Columbia University. Available at http://sedac.ciesin.columbia.edu/gpw.
Metadataclose[x]
SRT2-type drylands: population density
Gridded Population of the World, version 3 (GPWv3)
Center for International Earth Science Information Network (CIESIN), Columbia University; and Centro Internacional de Agricultura Tropical (CIAT). 2005. Gridded Population of the World Version 3 (GPWv3). Palisades, NY: Socioeconomic Data and Applications Center (SEDAC), Columbia University. Available at http://sedac.ciesin.columbia.edu/gpw.
Population Density Grids
Center for International Earth Science Information Network (CIESIN), Columbia University; and Centro Internacional de Agricultura Tropical (CIAT). 2005. Gridded Population of the World Version 3 (GPWv3): Population Density Grids. Palisades, NY: Socioeconomic Data and Applications Center (SEDAC), Columbia University. Available at http://sedac.ciesin.columbia.edu/gpw.

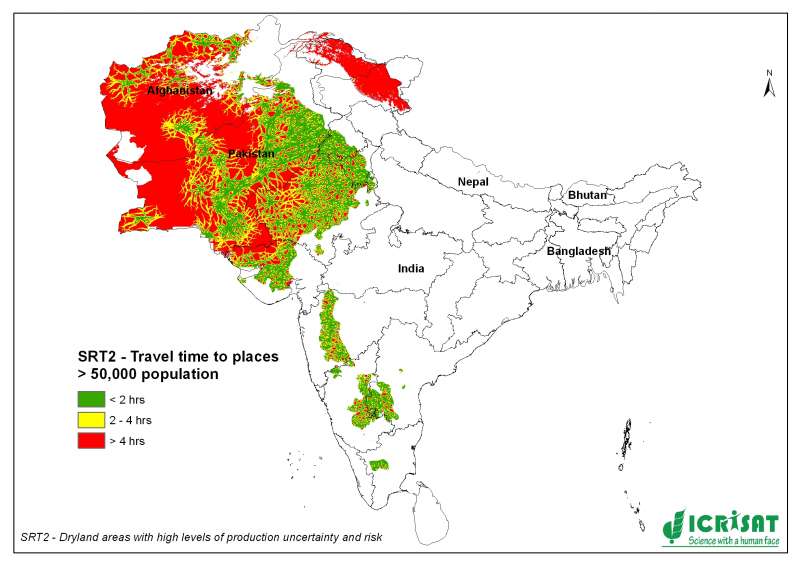
SRT2-type drylands: market access
This map was made for the World Bank's World Development Report
2009 Reshaping Economic Geography. The message of
the report can be summarised as:
Uchida, H. and Nelson, A. Agglomeration Index: Towards a New Measure of Urban Concentration. Background paper for the World Bank’s World Development Report 2009.
Uchida, H. and Nelson, A. (accepted) Agglomeration Index: Towards a New Measure of Urban Concentration. In: Guha-Khasnobis, B. (Ed), Development in an Urban World, UNU-WIDER
Metadataclose[x]
SRT2-type drylands: market access
This map was made for the World Bank's World Development Report
2009 Reshaping Economic Geography. The message of
the report can be summarised as:
Uchida, H. and Nelson, A. Agglomeration Index: Towards a New Measure of Urban Concentration. Background paper for the World Bank’s World Development Report 2009.
Uchida, H. and Nelson, A. (accepted) Agglomeration Index: Towards a New Measure of Urban Concentration. In: Guha-Khasnobis, B. (Ed), Development in an Urban World, UNU-WIDER

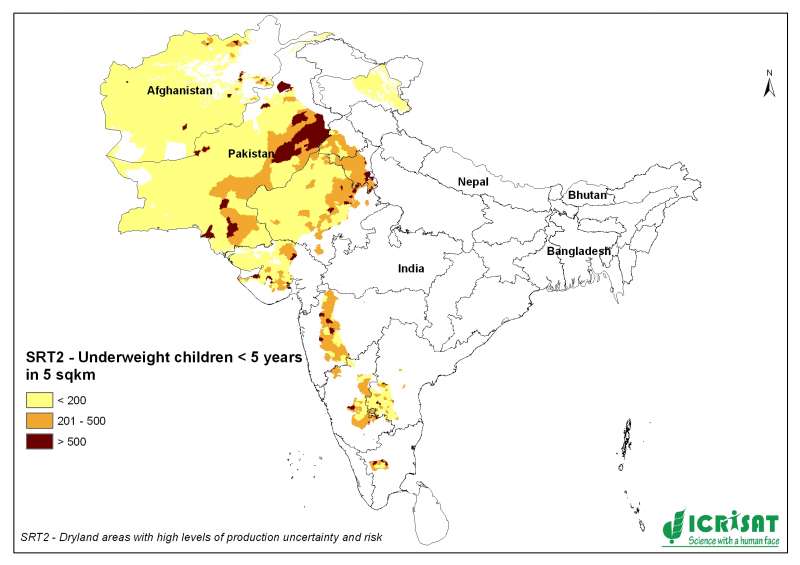
SRT2-type drylands: malnutrition/stunting data
Publication Date: 2005
Title: Poverty Mapping Project: Global Subnational Prevalence of Child Malnutrition
Geospatial Data Presentation Form: raster digital data, vector digital data, tabular digital data, map
Publication Information:
Publisher: CIESIN, Columbia University
Metadataclose[x]
SRT2-type drylands: malnutrition/stunting data
Publication Date: 2005
Title: Poverty Mapping Project: Global Subnational Prevalence of Child Malnutrition
Geospatial Data Presentation Form: raster digital data, vector digital data, tabular digital data, map
Publication Information:
Publisher: CIESIN, Columbia University

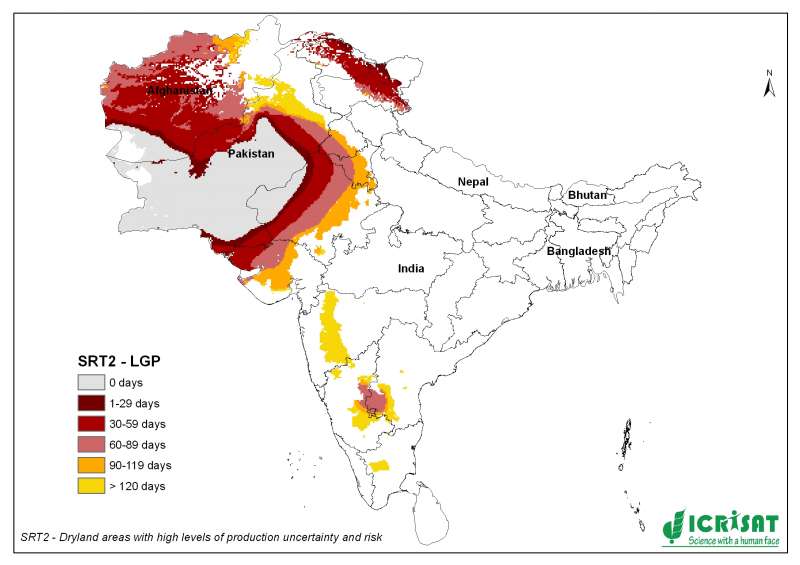
SRT2-type drylands: length of growing period
This is the period during the year when both moisture availability and temperature are conducive to crop growth. Thus, in a formal sense, LGP refers to the number of days within LGPwhen moisture conditions are considered adequate.
Metadataclose[x]
SRT2-type drylands: length of growing period
This is the period during the year when both moisture availability and temperature are conducive to crop growth. Thus, in a formal sense, LGP refers to the number of days within LGPwhen moisture conditions are considered adequate.

SRT2-type drylands: land use/land cover
Overview
The GLOBCOVER project was launched 2004 as an initiative of ESA which is now evolving to an international collaboration between ESA, FAO, UNEP, JRC, IGBP and GOFC-GOLD. The objective of GLOBCOVER is to produce a global land-cover map for the year 2005, using as main source of data the fine resolution (300 m) mode data from MERIS sensor on-board ENVISAT satellite, acquired over the full year 2005. This new product intends to complement and update other existing comparable global products, such as the global land cover map for the year 2000 (GLC 2000) with a resolution of 1 km produced by the JRC. Appropriate approaches for the validation of the land cover products are planned to be defined in consultation with CEOS.
Metadataclose[x]
SRT2-type drylands: land use/land cover
Overview
The GLOBCOVER project was launched 2004 as an initiative of ESA which is now evolving to an international collaboration between ESA, FAO, UNEP, JRC, IGBP and GOFC-GOLD. The objective of GLOBCOVER is to produce a global land-cover map for the year 2005, using as main source of data the fine resolution (300 m) mode data from MERIS sensor on-board ENVISAT satellite, acquired over the full year 2005. This new product intends to complement and update other existing comparable global products, such as the global land cover map for the year 2000 (GLC 2000) with a resolution of 1 km produced by the JRC. Appropriate approaches for the validation of the land cover products are planned to be defined in consultation with CEOS.

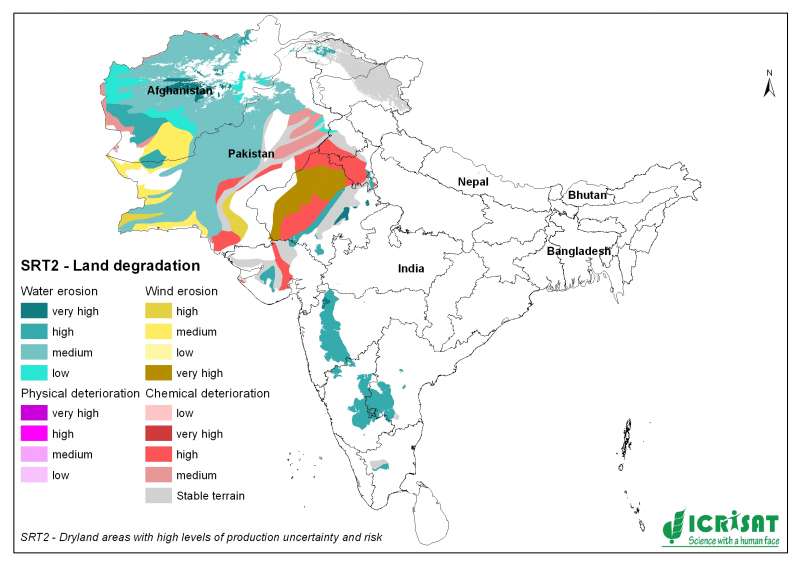
SRT2-type drylands: land degradation
Metadataclose[x]
SRT2-type drylands: land degradation

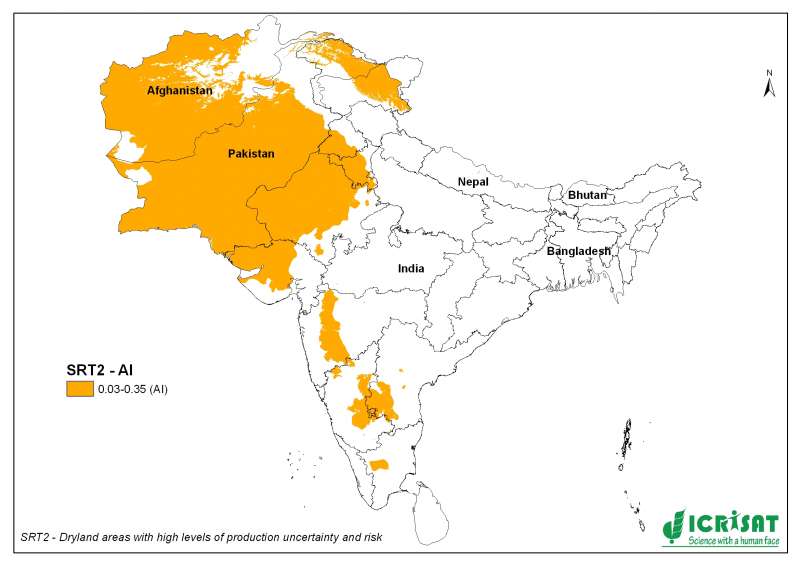
SRT2-type drylands: aridity index
| Value | Climate Class |
|
<
0.03 |
Hyper Arid |
|
0.03 –
0.2 |
Arid |
|
0.2 –
0.5 |
Semi-Arid |
|
0.5 –
0.65 |
Dry sub-humid |
|
> 0.65
|
Humid |
Metadataclose[x]
SRT2-type drylands: aridity index
| Value | Climate Class |
|
<
0.03 |
Hyper Arid |
|
0.03 –
0.2 |
Arid |
|
0.2 –
0.5 |
Semi-Arid |
|
0.5 –
0.65 |
Dry sub-humid |
|
> 0.65
|
Humid |
