


Geoinformatics Solutions for Integrated Agro-ecosystems Research
GIS Data
Maps in: Climate

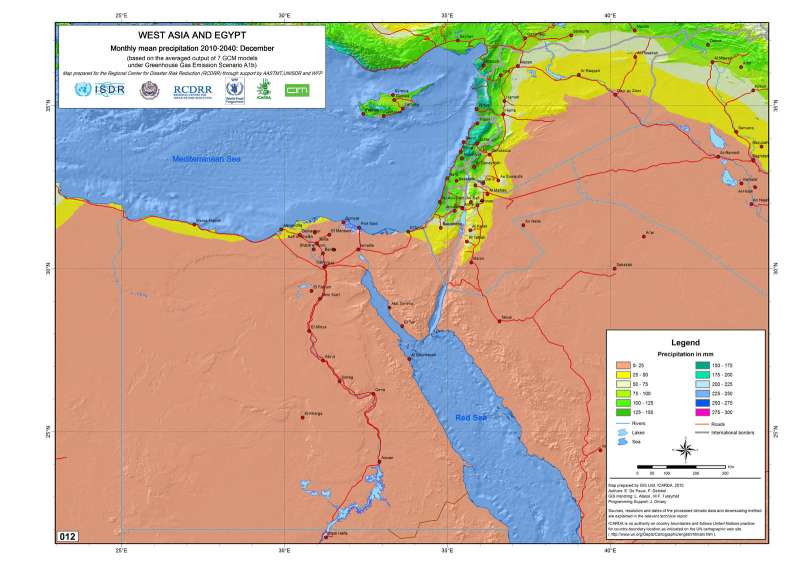
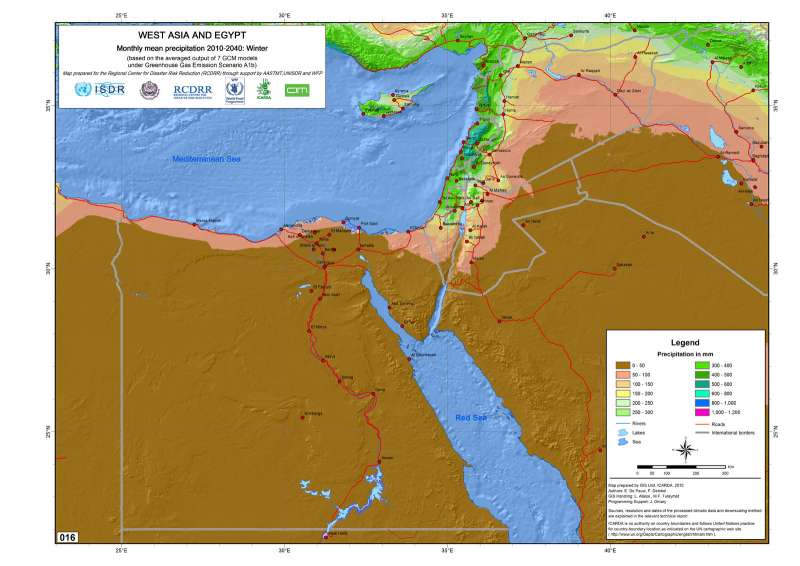
West Asia and Egypt. Monthly mean precipitation 2010-2040: December
West Asia and Egypt. Monthly mean precipitation 2010-2040: December (based on the averaged output of 7 GCM models under Greenhouse Gas Emission Scenario A1b)
Metadataclose[x]
West Asia and Egypt. Monthly mean precipitation 2010-2040: December
Baseline data to assist development agencies in planning for adaptation strategies to climate change
West Asia and Egypt. Monthly mean precipitation 2010-2040: December (based on the averaged output of 7 GCM models under Greenhouse Gas Emission Scenario A1b)
International Center for Agricultural Research in the Dry Areas (ICARDA)
2010
climate change, downscaling, GCM, precipitation, emission scenario A1b
West Asia, Egypt, Israel, Jordan, Lebanon, Occupied Palestinian Territories, Syria
15.329752
46.013085
44.627669
16.736002
D_WGS_1984
WGS_1984
6378137.000000
298.257224

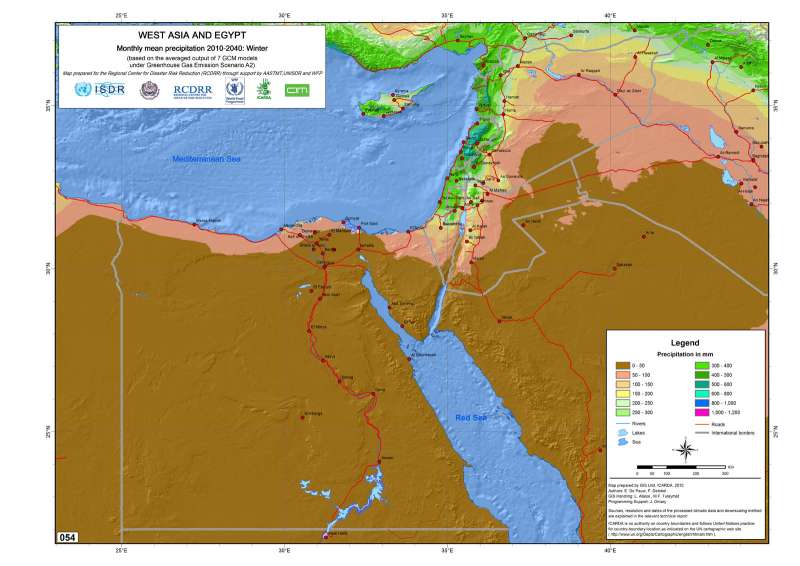
West Asia and Egypt. Monthly mean precipitation 2010-2040: December
West Asia and Egypt. Monthly mean precipitation 2010-2040: December (based on the averaged output of 7 GCM models under Greenhouse Gas Emission Scenario A2)
Metadataclose[x]
West Asia and Egypt. Monthly mean precipitation 2010-2040: December
Baseline data to assist development agencies in planning for adaptation strategies to climate change
West Asia and Egypt. Monthly mean precipitation 2010-2040: December (based on the averaged output of 7 GCM models under Greenhouse Gas Emission Scenario A2)
International Center for Agricultural Research in the Dry Areas (ICARDA)
2010
climate change, downscaling, GCM, precipitation, emission scenario A2
West Asia, Egypt, Israel, Jordan, Lebanon, Occupied Palestinian Territories, Syria
15.329752
46.013085
44.627669
16.736002
D_WGS_1984
WGS_1984
6378137.000000
298.257224

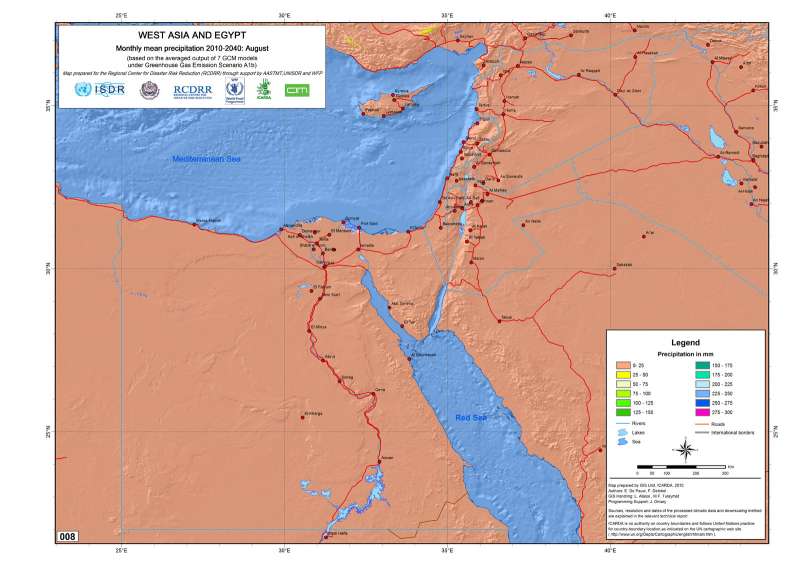
West Asia and Egypt. Monthly mean precipitation 2010-2040: August
West Asia and Egypt. Monthly mean precipitation 2010-2040: August (based on the averaged output of 7 GCM models under Greenhouse Gas Emission Scenario A1b)
Metadataclose[x]
West Asia and Egypt. Monthly mean precipitation 2010-2040: August
Baseline data to assist development agencies in planning for adaptation strategies to climate change
West Asia and Egypt. Monthly mean precipitation 2010-2040: August (based on the averaged output of 7 GCM models under Greenhouse Gas Emission Scenario A1b)
International Center for Agricultural Research in the Dry Areas (ICARDA)
2010
climate change, downscaling, GCM, emission scenario A1b, precipitation
West Asia, Egypt, Israel, Jordan, Lebanon, Occupied Palestinian Territories, Syria
15.329752
46.013085
44.627669
16.736002
D_WGS_1984
WGS_1984
6378137.000000
298.257224

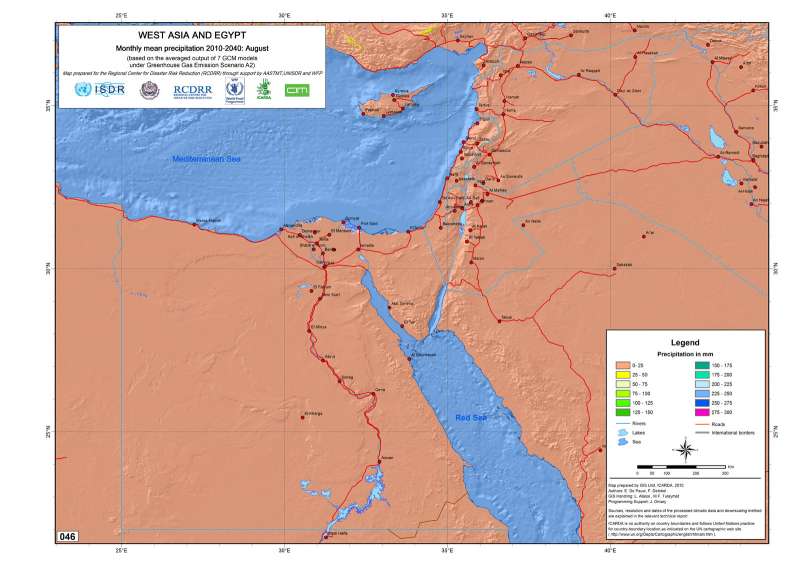
West Asia and Egypt. Monthly mean precipitation 2010-2040: August
West Asia and Egypt. Monthly mean precipitation 2010-2040: August (based on the averaged output of 7 GCM models under Greenhouse Gas Emission Scenario A2)
Metadataclose[x]
West Asia and Egypt. Monthly mean precipitation 2010-2040: August
Baseline data to assist development agencies in planning for adaptation strategies to climate change
West Asia and Egypt. Monthly mean precipitation 2010-2040: August (based on the averaged output of 7 GCM models under Greenhouse Gas Emission Scenario A2)
International Center for Agricultural Research in the Dry Areas (ICARDA)
2010
climate change, downscaling, GCM, precipitation, emission scenario A2
West Asia, Egypt, Israel, Jordan, Lebanon, Occupied Palestinian Territories, Syria
15.329752
46.013085
44.627669
16.736002
D_WGS_1984
WGS_1984
6378137.000000
298.257224

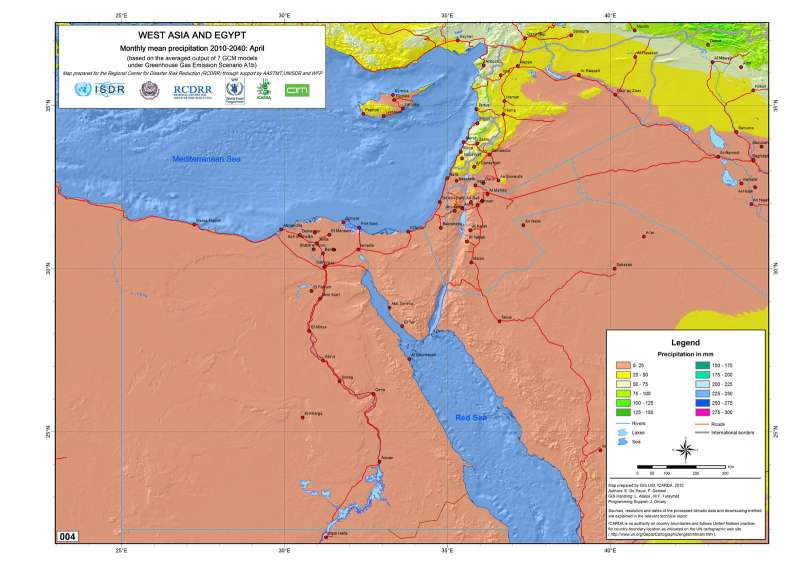
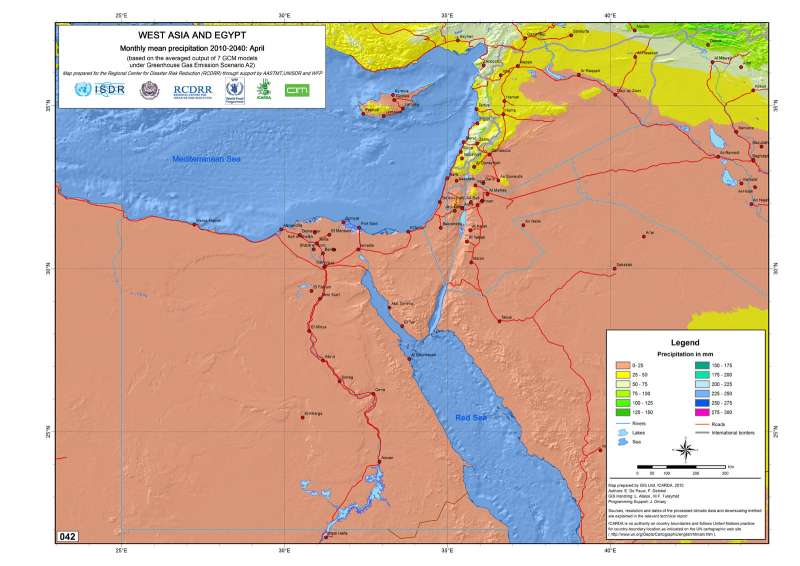
West Asia and Egypt. Monthly mean precipitation 2010-2040: April
West Asia and Egypt. Monthly mean precipitation 2010-2040: April (based on the averaged output of 7 GCM models under Greenhouse Gas Emission Scenario A1b)
Metadataclose[x]
West Asia and Egypt. Monthly mean precipitation 2010-2040: April
Baseline data to assist development agencies in planning for adaptation strategies to climate change
West Asia and Egypt. Monthly mean precipitation 2010-2040: April (based on the averaged output of 7 GCM models under Greenhouse Gas Emission Scenario A1b)
International Center for Agricultural Research in the Dry Areas (ICARDA)
2010
climate change, downscaling, GCM, precipitation, emission scenario A1b
West Asia, Egypt, Israel, Jordan, Lebanon, Occupied Palestinian Territories, Syria
15.329752
46.013085
44.627669
16.736002
D_WGS_1984
WGS_1984
6378137.000000
298.257224

West Asia and Egypt. Monthly mean precipitation 2010-2040: April
West Asia and Egypt. Monthly mean precipitation 2010-2040: April (based on the averaged output of 7 GCM models under Greenhouse Gas Emission Scenario A2)
Metadataclose[x]
West Asia and Egypt. Monthly mean precipitation 2010-2040: April
Baseline data to assist development agencies in planning for adaptation strategies to climate change
West Asia and Egypt. Monthly mean precipitation 2010-2040: April (based on the averaged output of 7 GCM models under Greenhouse Gas Emission Scenario A2)
International Center for Agricultural Research in the Dry Areas (ICARDA)
2010
climate change, downscaling, GCM, precipitation, emission scenario A2
West Asia, Egypt, Israel, Jordan, Lebanon, Occupied Palestinian Territories, Syria
15.329752
46.013085
44.627669
16.736002
D_WGS_1984
WGS_1984
6378137.000000
298.257224

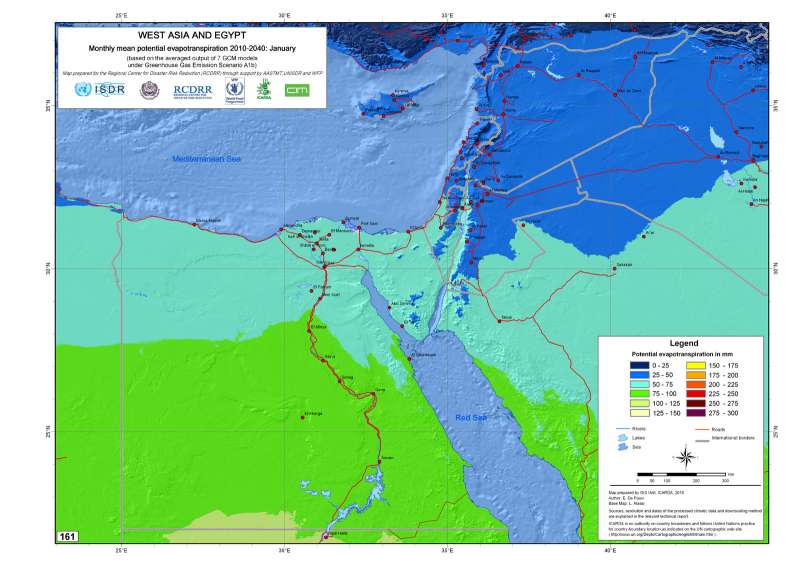
West Asia and Egypt. Monthly mean potential evapotranspiration 2010-2040: January
West Asia and Egypt. Monthly mean potential evapotranspiration 2010-2040: January (based on the averaged output of 7 GCM models under Greenhouse Gas Emission Scenario A1b)
Metadataclose[x]
West Asia and Egypt. Monthly mean potential evapotranspiration 2010-2040: January
Baseline data to assist development agencies in planning for adaptation strategies to climate change
West Asia and Egypt. Monthly mean potential evapotranspiration 2010-2040: January (based on the averaged output of 7 GCM models under Greenhouse Gas Emission Scenario A1b)
International Center for Agricultural Research in the Dry Areas (ICARDA)
2010
climate change, potential evapotranspiration, GCM, downscaling, emission scenario A1b
West Asia, Egypt, Lebanon, Occupied Palestinian Territories, Syria, Jordan, Israel
22.000000
46.000000
40.000000
18.000000
D_WGS_1984
WGS_1984
6378137.000000
298.257224

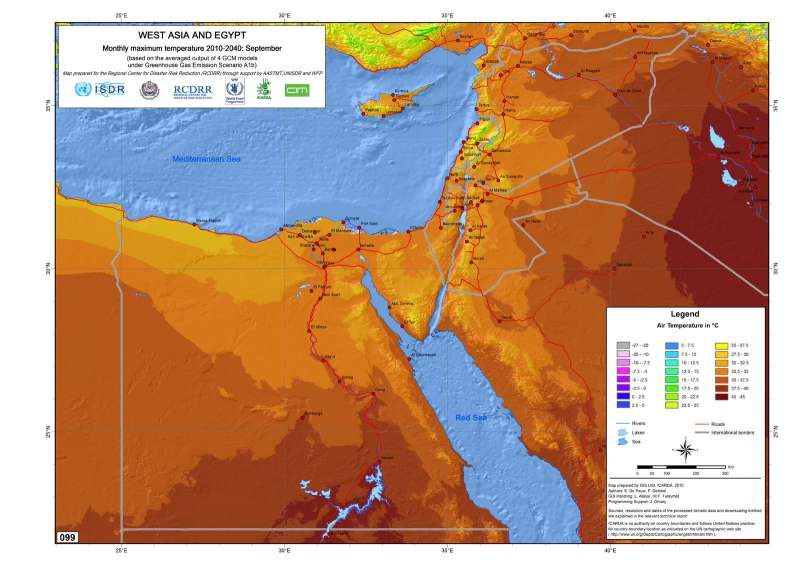
West Asia and Egypt. Monthly maximum temperature 2010-2040: September
West Asia and Egypt. Monthly maximum temperature 2010-2040: September (based on the averaged output of 7 GCM models under Greenhouse Gas Emission Scenario A1b)
Metadataclose[x]
West Asia and Egypt. Monthly maximum temperature 2010-2040: September
Baseline data to assist development agencies in planning for adaptation strategies to climate change
West Asia and Egypt. Monthly maximum temperature 2010-2040: September (based on the averaged output of 7 GCM models under Greenhouse Gas Emission Scenario A1b)
International Center for Agricultural Research in the Dry Areas (ICARDA)
2010
climate change, downscaling, GCM, temperature, emission scenario A1b
West Asia, Egypt, Israel, Jordan, Lebanon, Occupied Palestinian Territories, Syria
22.000000
46.000000
40.000000
18.000000
D_WGS_1984
WGS_1984
6378137.000000
298.257224

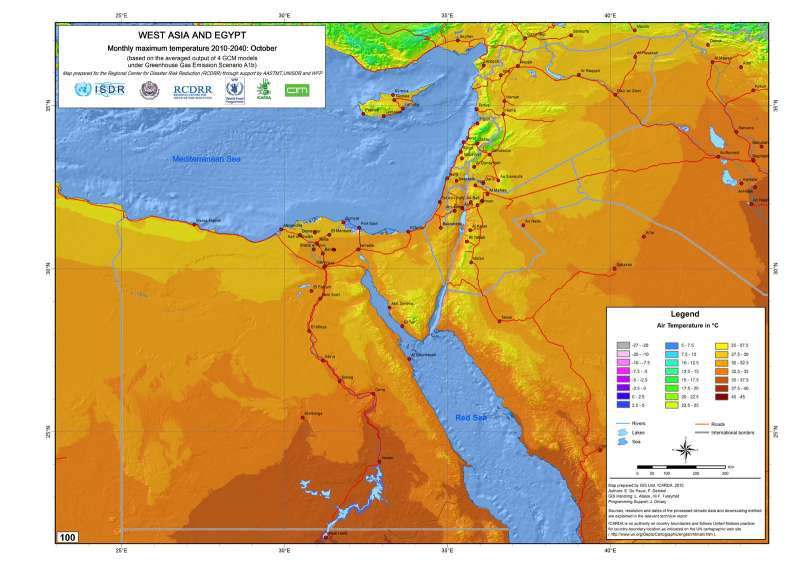
West Asia and Egypt. Monthly maximum temperature 2010-2040: October
West Asia and Egypt. Monthly maximum temperature 2010-2040: October (based on the averaged output of 7 GCM models under Greenhouse Gas Emission Scenario A1b)
Metadataclose[x]
West Asia and Egypt. Monthly maximum temperature 2010-2040: October
Baseline data to assist development agencies in planning for adaptation strategies to climate change
West Asia and Egypt. Monthly maximum temperature 2010-2040: October (based on the averaged output of 7 GCM models under Greenhouse Gas Emission Scenario A1b)
International Center for Agricultural Research in the Dry Areas (ICARDA)
2010
climate change, downscaling, GCM, temperature, emission scenario A1b
West Asia, Egypt, Israel, Jordan, Lebanon, Occupied Palestinian Territories, Syria
22.000000
46.000000
40.000000
18.000000
D_WGS_1984
WGS_1984
6378137.000000
298.257224

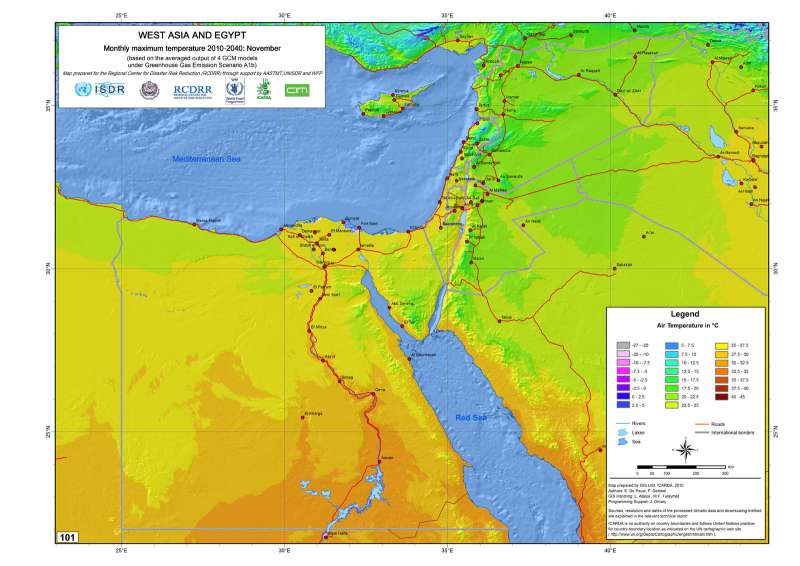
West Asia and Egypt. Monthly maximum temperature 2010-2040: November
West Asia and Egypt. Monthly maximum temperature 2010-2040: November (based on the averaged output of 7 GCM models under Greenhouse Gas Emission Scenario A1b)
Metadataclose[x]
West Asia and Egypt. Monthly maximum temperature 2010-2040: November
Baseline data to assist development agencies in planning for adaptation strategies to climate change
West Asia and Egypt. Monthly maximum temperature 2010-2040: November (based on the averaged output of 7 GCM models under Greenhouse Gas Emission Scenario A1b)
International Center for Agricultural Research in the Dry Areas (ICARDA)
2010
climate change, downscaling, GCM, temperature, emission scenario A1b
West Asia, Egypt, Israel, Jordan, Lebanon, Occupied Palestinian Territories, Syria
22.000000
46.000000
40.000000
18.000000
D_WGS_1984
WGS_1984
6378137.000000
298.257224

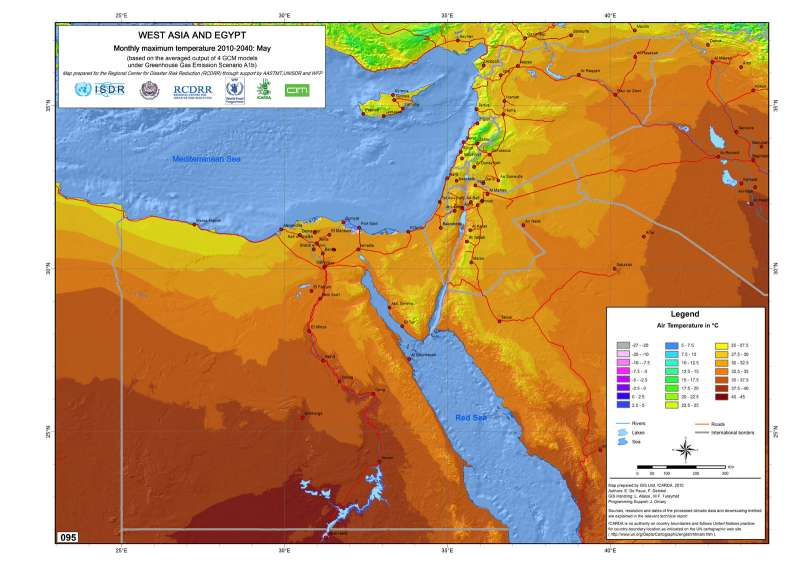
West Asia and Egypt. Monthly maximum temperature 2010-2040: May
West Asia and Egypt. Monthly maximum temperature 2010-2040: May (based on the averaged output of 7 GCM models under Greenhouse Gas Emission Scenario A1b)
Metadataclose[x]
West Asia and Egypt. Monthly maximum temperature 2010-2040: May
Baseline data to assist development agencies in planning for adaptation strategies to climate change
West Asia and Egypt. Monthly maximum temperature 2010-2040: May (based on the averaged output of 7 GCM models under Greenhouse Gas Emission Scenario A1b)
International Center for Agricultural Research in the Dry Areas (ICARDA)
2010
climate change, downscaling, GCM, GCM, temperature, emission scenario A1b
West Asia, Egypt, Israel, Jordan, Lebanon, Occupied Palestinian Territories, Syria
22.000000
46.000000
40.000000
18.000000
D_WGS_1984
WGS_1984
6378137.000000
298.257224

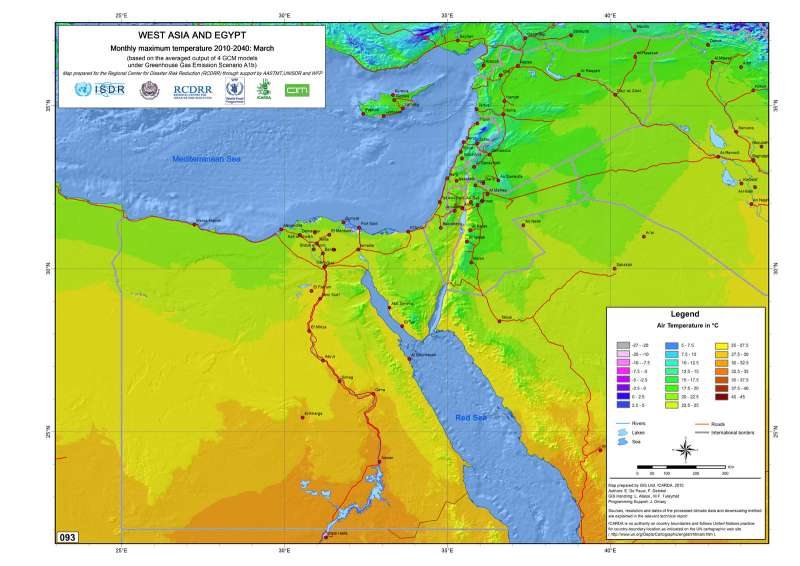
West Asia and Egypt. Monthly maximum temperature 2010-2040: March
West Asia and Egypt. Monthly maximum temperature 2010-2040: March (based on the averaged output of 7 GCM models under Greenhouse Gas Emission Scenario A1b)
Metadataclose[x]
West Asia and Egypt. Monthly maximum temperature 2010-2040: March
Baseline data to assist development agencies in planning for adaptation strategies to climate change
West Asia and Egypt. Monthly maximum temperature 2010-2040: March (based on the averaged output of 7 GCM models under Greenhouse Gas Emission Scenario A1b)
International Center for Agricultural Research in the Dry Areas (ICARDA)
2010
climate change, downscaling, GCM, temperature, emission scenario A1b
West Asia, Egypt, Israel, Jordan, Lebanon, Occupied Palestinian Territories, Syria
22.000000
46.000000
40.000000
18.000000
D_WGS_1984
WGS_1984
6378137.000000
298.257224

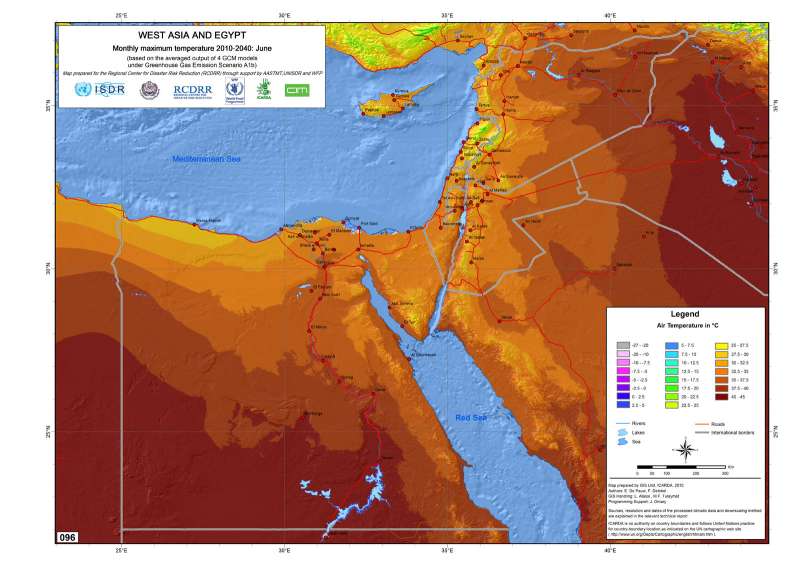
West Asia and Egypt. Monthly maximum temperature 2010-2040: June
West Asia and Egypt. Monthly maximum temperature 2010-2040: June (based on the averaged output of 7 GCM models under Greenhouse Gas Emission Scenario A1b)
Metadataclose[x]
West Asia and Egypt. Monthly maximum temperature 2010-2040: June
Baseline data to assist development agencies in planning for adaptation strategies to climate change
West Asia and Egypt. Monthly maximum temperature 2010-2040: June (based on the averaged output of 7 GCM models under Greenhouse Gas Emission Scenario A1b)
International Center for Agricultural Research in the Dry Areas (ICARDA)
2010
climate change, downscaling, GCM, temperature, emission scenario A1b
West Asia, Egypt, Israel, Jordan, Lebanon, Occupied Palestinian Territories, Syria
22.000000
46.000000
40.000000
18.000000
D_WGS_1984
WGS_1984
6378137.000000
298.257224

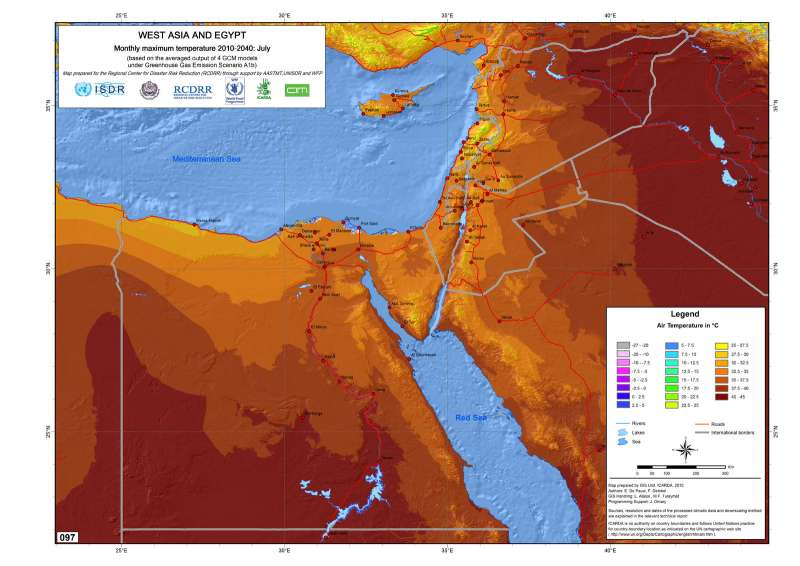
West Asia and Egypt. Monthly maximum temperature 2010-2040: July
West Asia and Egypt. Monthly maximum temperature 2010-2040: July (based on the averaged output of 7 GCM models under Greenhouse Gas Emission Scenario A1b)
Metadataclose[x]
West Asia and Egypt. Monthly maximum temperature 2010-2040: July
Baseline data to assist development agencies in planning for adaptation strategies to climate change
West Asia and Egypt. Monthly maximum temperature 2010-2040: July (based on the averaged output of 7 GCM models under Greenhouse Gas Emission Scenario A1b)
International Center for Agricultural Research in the Dry Areas (ICARDA)
2010
climate change, downscaling, GCM, temperature, emission scenario A1b
West Asia, Egypt, Israel, Jordan, Lebanon, Occupied Palestinian Territories, Syria
22.000000
46.000000
40.000000
18.000000
D_WGS_1984
WGS_1984
6378137.000000
298.257224

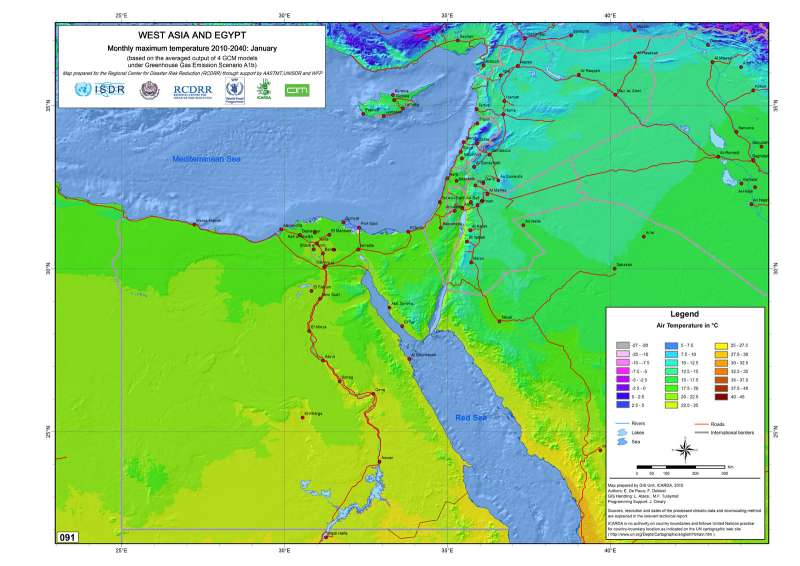
West Asia and Egypt. Monthly maximum temperature 2010-2040: January
West Asia and Egypt. Monthly maximum temperature 2010-2040: January (based on the averaged output of 7 GCM models under Greenhouse Gas Emission Scenario A1b)
Metadataclose[x]
West Asia and Egypt. Monthly maximum temperature 2010-2040: January
Baseline data to assist development agencies in planning for adaptation strategies to climate change
West Asia and Egypt. Monthly maximum temperature 2010-2040: January (based on the averaged output of 7 GCM models under Greenhouse Gas Emission Scenario A1b)
International Center for Agricultural Research in the Dry Areas (ICARDA)
2010
climate change, downscaling, GCM, temperature, emission scenario A1b
West Asia, Egypt, Israel, Jordan, Lebanon, Occupied Palestinian Territories, Syria
22.000000
46.000000
40.000000
18.000000
D_WGS_1984
WGS_1984
6378137.000000
298.257224

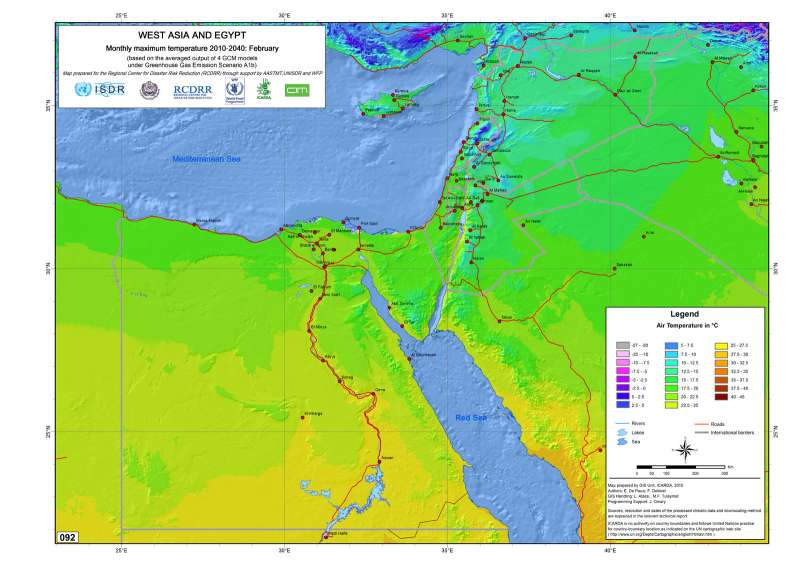
West Asia and Egypt. Monthly maximum temperature 2010-2040: February
West Asia and Egypt. Monthly maximum temperature 2010-2040: February (based on the averaged output of 7 GCM models under Greenhouse Gas Emission Scenario A1b)
Metadataclose[x]
West Asia and Egypt. Monthly maximum temperature 2010-2040: February
Baseline data to assist development agencies in planning for adaptation strategies to climate change
West Asia and Egypt. Monthly maximum temperature 2010-2040: February (based on the averaged output of 7 GCM models under Greenhouse Gas Emission Scenario A1b)
International Center for Agricultural Research in the Dry Areas (ICARDA)
2010
climate change, downscaling, GCM, temperature, emission scenario A1b
West Asia, Egypt, Israel, Jordan, Lebanon, Occupied Palestinian Territories, Syria
22.000000
46.000000
40.000000
18.000000
D_WGS_1984
WGS_1984
6378137.000000
298.257224

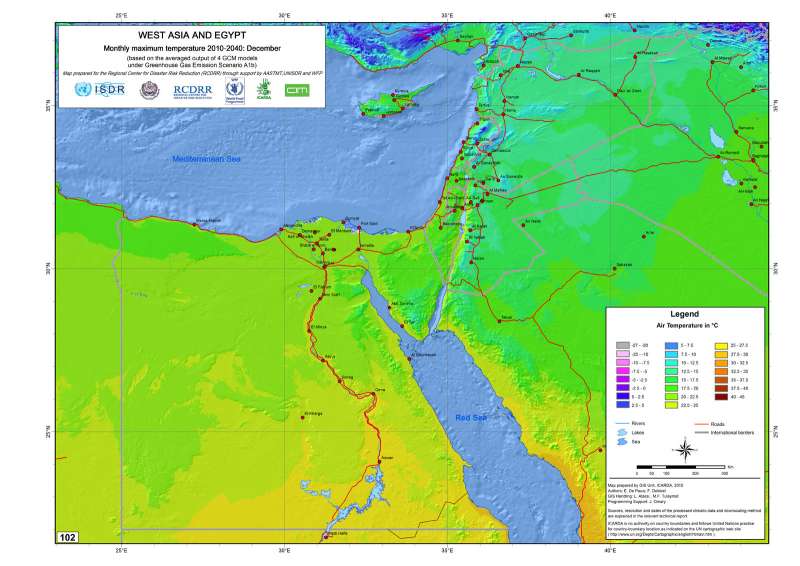
West Asia and Egypt. Monthly maximum temperature 2010-2040: December
West Asia and Egypt. Monthly maximum temperature 2010-2040: December (based on the averaged output of 7 GCM models under Greenhouse Gas Emission Scenario A1b)
Metadataclose[x]
West Asia and Egypt. Monthly maximum temperature 2010-2040: December
Baseline data to assist development agencies in planning for adaptation strategies to climate change
West Asia and Egypt. Monthly maximum temperature 2010-2040: December (based on the averaged output of 7 GCM models under Greenhouse Gas Emission Scenario A1b)
International Center for Agricultural Research in the Dry Areas (ICARDA)
2010
climate change, downscaling, GCM, temperature, emission scenario A1b
West Asia, Egypt, Israel, Jordan, Lebanon, Occupied Palestinian Territories, Syria
22.000000
46.000000
40.000000
18.000000
D_WGS_1984
WGS_1984
6378137.000000
298.257224

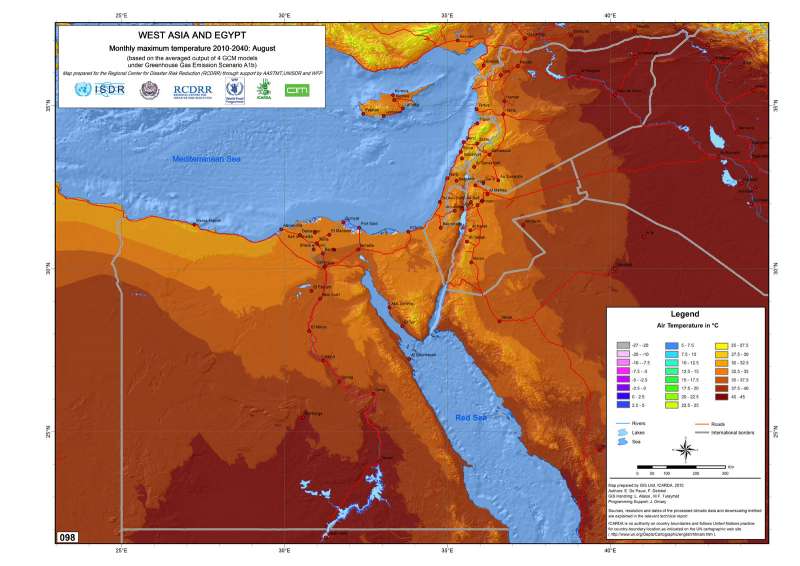
West Asia and Egypt. Monthly maximum temperature 2010-2040: August
West Asia and Egypt. Monthly maximum temperature 2010-2040: August (based on the averaged output of 7 GCM models under Greenhouse Gas Emission Scenario A1b)
Metadataclose[x]
West Asia and Egypt. Monthly maximum temperature 2010-2040: August
Baseline data to assist development agencies in planning for adaptation strategies to climate change
West Asia and Egypt. Monthly maximum temperature 2010-2040: August (based on the averaged output of 7 GCM models under Greenhouse Gas Emission Scenario A1b)
International Center for Agricultural Research in the Dry Areas (ICARDA)
2010
climate change, downscaling, GCM, temperature, emission scenario A1b
West Asia, Egypt, Israel, Jordan, Lebanon, Occupied Palestinian Territories, Syria
22.000000
46.000000
40.000000
18.000000
D_WGS_1984
WGS_1984
6378137.000000
298.257224

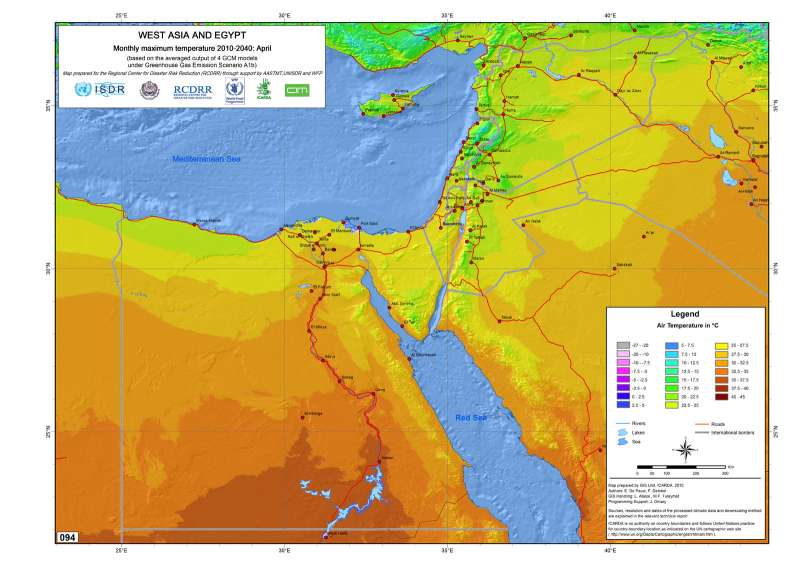
West Asia and Egypt. Monthly maximum temperature 2010-2040: April
West Asia and Egypt. Monthly maximum temperature 2010-2040: April (based on the averaged output of 7 GCM models under Greenhouse Gas Emission Scenario A1b)
Metadataclose[x]
West Asia and Egypt. Monthly maximum temperature 2010-2040: April
Baseline data to assist development agencies in planning for adaptation strategies to climate change
West Asia and Egypt. Monthly maximum temperature 2010-2040: April (based on the averaged output of 7 GCM models under Greenhouse Gas Emission Scenario A1b)
International Center for Agricultural Research in the Dry Areas (ICARDA)
2010
climate change, downscaling, GCM, temperature, emission scenario A1b
West Asia, Egypt, Israel, Jordan, Lebanon, Occupied Palestinian Territories, Syria
22.000000
46.000000
40.000000
18.000000
D_WGS_1984
WGS_1984
6378137.000000
298.257224

West Asia and Egypt. Mean winter precipitation 2010-2040
West Asia and Egypt. Mean winter precipitation 2010-2040 (based on the averaged output of 7 GCM models under Greenhouse Gas Emission Scenario A1b)
Metadataclose[x]
West Asia and Egypt. Mean winter precipitation 2010-2040
Baseline data to assist development agencies in planning for adaptation strategies to climate change
West Asia and Egypt. Mean winter precipitation 2010-2040 (based on the averaged output of 7 GCM models under Greenhouse Gas Emission Scenario A1b)
International Center for Agricultural Research in the Dry Areas (ICARDA)
2010
climate change, downscaling, GCM, precipitation, emission scenario A1b
West Asia, Egypt, Israel, Jordan, Lebanon, Occupied Palestinian Territories, Syria
15.329752
46.013085
44.627669
16.736002
D_WGS_1984
WGS_1984
6378137.000000
298.257224

West Asia and Egypt. Mean winter precipitation 2010-2040
West Asia and Egypt. Mean winter precipitation 2010-2040 (based on the averaged output of 7 GCM models under Greenhouse Gas Emission Scenario A2)
Metadataclose[x]
West Asia and Egypt. Mean winter precipitation 2010-2040
Baseline data to assist development agencies in planning for adaptation strategies to climate change
West Asia and Egypt. Mean winter precipitation 2010-2040 (based on the averaged output of 7 GCM models under Greenhouse Gas Emission Scenario A2)
International Center for Agricultural Research in the Dry Areas (ICARDA)
2010
climate change, downscaling, GCM, precipitation, emission scenario A2
West Asia, Egypt, Israel, Jordan, Lebanon, Occupied Palestinian Territories, Syria
15.329752
46.013085
44.627669
16.736002
D_WGS_1984
WGS_1984
6378137.000000
298.257224

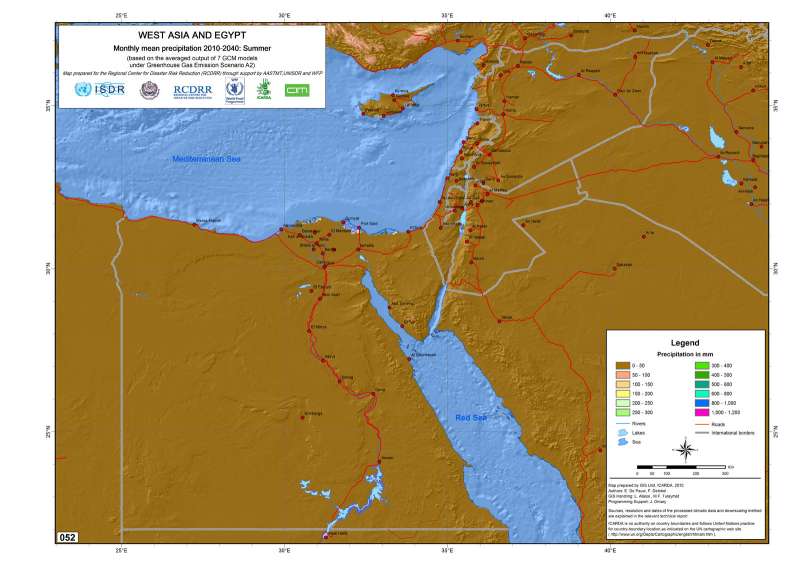
West Asia and Egypt. Mean summer precipitation 2010-2040
West Asia and Egypt. Mean summer precipitation 2010-2040 (based on the averaged output of 7 GCM models under Greenhouse Gas Emission Scenario A1b)
Metadataclose[x]
West Asia and Egypt. Mean summer precipitation 2010-2040
Baseline data to assist development agencies in planning for adaptation strategies to climate change
West Asia and Egypt. Mean summer precipitation 2010-2040 (based on the averaged output of 7 GCM models under Greenhouse Gas Emission Scenario A1b)
International Center for Agricultural Research in the Dry Areas (ICARDA)
2010
climate change, downscaling, GCM, precipitation, emission scenario A1b
West Asia, Egypt, Israel, Jordan, Lebanon, Occupied Palestinian Territories, Syria
15.329752
46.013085
44.627669
16.736002
D_WGS_1984
WGS_1984
6378137.000000
298.257224

West Asia and Egypt. Mean summer precipitation 2010-2040
West Asia and Egypt. Mean summer precipitation 2010-2040 (based on the averaged output of 7 GCM models under Greenhouse Gas Emission Scenario A2)
Metadataclose[x]
West Asia and Egypt. Mean summer precipitation 2010-2040
Baseline data to assist development agencies in planning for adaptation strategies to climate change
West Asia and Egypt. Mean summer precipitation 2010-2040 (based on the averaged output of 7 GCM models under Greenhouse Gas Emission Scenario A2)
International Center for Agricultural Research in the Dry Areas (ICARDA)
2010
climate change, downscaling, GCM, precipitation, emission scenario A2
West Asia, Egypt, Israel, Jordan, Lebanon, Occupied Palestinian Territories, Syria
15.329752
46.013085
44.627669
16.736002
D_WGS_1984
WGS_1984
6378137.000000
298.257224

West Asia and Egypt. Mean spring precipitation 2010-2040
West Asia and Egypt. Mean spring precipitation 2010-2040 (based on the averaged output of 7 GCM models under Greenhouse Gas Emission Scenario A1b)
Metadataclose[x]
West Asia and Egypt. Mean spring precipitation 2010-2040
Baseline data to assist development agencies in planning for adaptation strategies to climate change
West Asia and Egypt. Mean spring precipitation 2010-2040 (based on the averaged output of 7 GCM models under Greenhouse Gas Emission Scenario A1b)
International Center for Agricultural Research in the Dry Areas (ICARDA)
2010
climate change, downscaling, GCM, precipitation, emission scenario A1b
West Asia, Egypt, Israel, Jordan, Lebanon, Occupied Palestinian Territories, Syria
15.329752
46.013085
44.627669
16.736002
D_WGS_1984
WGS_1984
6378137.000000
298.257224

West Asia and Egypt. Mean spring precipitation 2010-2040
West Asia and Egypt. Mean spring precipitation 2010-2040 (based on the averaged output of 7 GCM models under Greenhouse Gas Emission Scenario A2)
Metadataclose[x]
West Asia and Egypt. Mean spring precipitation 2010-2040
Baseline data to assist development agencies in planning for adaptation strategies to climate change
West Asia and Egypt. Mean spring precipitation 2010-2040 (based on the averaged output of 7 GCM models under Greenhouse Gas Emission Scenario A2)
International Center for Agricultural Research in the Dry Areas (ICARDA)
2010
climate change, downscaling, GCM, precipitation, emission scenario A2
West Asia, Egypt, Israel, Jordan, Lebanon, Occupied Palestinian Territories, Syria
15.329752
46.013085
44.627669
16.736002
D_WGS_1984
WGS_1984
6378137.000000
298.257224

West Asia and Egypt. Mean autumn precipitation 2010-2040
West Asia and Egypt. Mean autumn precipitation 2010-2040 (based on the averaged output of 7 GCM models under Greenhouse Gas Emission Scenario A1b)
Metadataclose[x]
West Asia and Egypt. Mean autumn precipitation 2010-2040
Baseline data to assist development agencies in planning for adaptation strategies to climate change
West Asia and Egypt. Mean autumn precipitation 2010-2040 (based on the averaged output of 7 GCM models under Greenhouse Gas Emission Scenario A1b)
International Center for Agricultural Research in the Dry Areas (ICARDA)
2010
climate change, downscaling, GCM, precipitation, emission scenario A1b
West Asia, Egypt, Israel, Jordan, Lebanon, Occupied Palestinian Territories, Syria
15.329752
46.013085
44.627669
16.736002
D_WGS_1984
WGS_1984
6378137.000000
298.257224

West Asia and Egypt. Mean autumn precipitation 2010-2040
West Asia and Egypt. Mean autumn precipitation 2010-2040 (based on the averaged output of 7 GCM models under Greenhouse Gas Emission Scenario A2)
Metadataclose[x]
West Asia and Egypt. Mean autumn precipitation 2010-2040
Baseline data to assist development agencies in planning for adaptation strategies to climate change
West Asia and Egypt. Mean autumn precipitation 2010-2040 (based on the averaged output of 7 GCM models under Greenhouse Gas Emission Scenario A2)
International Center for Agricultural Research in the Dry Areas (ICARDA)
2010
climate change, downscaling, GCM, precipitation, emission scenario A2
West Asia, Egypt, Israel, Jordan, Lebanon, Occupied Palestinian Territories, Syria
15.329752
46.013085
44.627669
16.736002
D_WGS_1984
WGS_1984
6378137.000000
298.257224

West Asia and Egypt. Mean annual temperature 2010-2040
West Asia and Egypt. Mean annual temperature 2010-2040 (based on the averaged output of 7 GCM models under Greenhouse Gas Emission Scenario A1b)
Metadataclose[x]
West Asia and Egypt. Mean annual temperature 2010-2040
Baseline data to assist development agencies in planning for adaptation strategies to climate change
West Asia and Egypt. Mean annual temperature 2010-2040 (based on the averaged output of 7 GCM models under Greenhouse Gas Emission Scenario A1b)
International Center for Agricultural Research in the Dry Areas (ICARDA)
2010
climate change, downscaling, GCM, temperature, emission scenario A1b
West Asia, Egypt, Israel, Jordan, Lebanon, Occupied Palestinian Territories, Syria
22.000000
46.000000
40.000000
18.000000
D_WGS_1984
WGS_1984
6378137.000000
298.257224

West Asia and Egypt. Mean annual temperature 2010-2040
West Asia and Egypt. Mean annual temperature 2010-2040 (based on the averaged output of 7 GCM models under Greenhouse Gas Emission Scenario A2)
Metadataclose[x]
West Asia and Egypt. Mean annual temperature 2010-2040
Baseline data to assist development agencies in planning for adaptation strategies to climate change
West Asia and Egypt. Mean annual temperature 2010-2040 (based on the averaged output of 7 GCM models under Greenhouse Gas Emission Scenario A2)
International Center for Agricultural Research in the Dry Areas (ICARDA)
2010
climate change, downscaling, GCM, temperature, emission scenario A2
West Asia, Egypt, Israel, Jordan, Lebanon, Occupied Palestinian Territories, Syria
22.000000
46.000000
40.000000
18.000000
D_WGS_1984
WGS_1984
6378137.000000
298.257224

West Asia and Egypt. Change in the share of winter precipitation 2010-2040 - current climate, GHG scenario A1b
West Asia and Egypt. Change in the share of winter precipitation 2010-2040 - current climate (based on the averaged output of 7 GCM models under Greenhouse Gas Emission Scenario A1b
Metadataclose[x]
West Asia and Egypt. Change in the share of winter precipitation 2010-2040 - current climate, GHG scenario A1b
Baseline data to assist development agencies in planning for adaptation strategies to climate change
West Asia and Egypt. Change in the share of winter precipitation 2010-2040 - current climate (based on the averaged output of 7 GCM models under Greenhouse Gas Emission Scenario A1b
International Center for Agricultural Research in the Dry Areas (ICARDA)
2010
climate change, downscaling, GCM, precipitation, emission scenario A1b
West Asia, Egypt, Israel, Jordan, Lebanon, Occupied Palestinian Territories, Syria
15.329752
46.013085
44.627669
16.736002
D_WGS_1984
WGS_1984
6378137.000000
298.257224

West Asia and Egypt. Change in the share of winter precipitation 2010-2040 - current climate
West Asia and Egypt. Change in the share of winter precipitation 2010-2040 - current climate (based on the averaged output of 7 GCM models under Greenhouse Gas Emission Scenario A2)
Metadataclose[x]
West Asia and Egypt. Change in the share of winter precipitation 2010-2040 - current climate
Baseline data to assist development agencies in planning for adaptation strategies to climate change
West Asia and Egypt. Change in the share of winter precipitation 2010-2040 - current climate (based on the averaged output of 7 GCM models under Greenhouse Gas Emission Scenario A2)
International Center for Agricultural Research in the Dry Areas (ICARDA)
2010
climate change, downscaling, GCM, precipitation, emission scenario A2
West Asia, Egypt, Israel, Jordan, Lebanon, Occupied Palestinian Territories, Syria
15.329752
46.013085
44.627669
16.736002
D_WGS_1984
WGS_1984
6378137.000000
298.257224

West Asia and Egypt. Change in the share of summer precipitation 2010-2040 - current climate
West Asia and Egypt. Change in the share of summer precipitation 2010-2040 - current climate, GHG scenario A1b
Metadataclose[x]
West Asia and Egypt. Change in the share of summer precipitation 2010-2040 - current climate
Baseline data to assist development agencies in planning for adaptation strategies to climate change
West Asia and Egypt. Change in the share of summer precipitation 2010-2040 - current climate, GHG scenario A1b
International Center for Agricultural Research in the Dry Areas (ICARDA)
2010
climate change, downscaling, GCM, precipitation, emission scenario A1b
West Asia, Egypt, Israel, Jordan, Lebanon, Occupied Palestinian Territories, Syria
15.329752
46.013085
44.627669
16.736002
D_WGS_1984
WGS_1984
6378137.000000
298.257224

West Asia and Egypt. Change in the share of summer precipitation 2010-2040 - current climate
West Asia and Egypt. Change in the share of summer precipitation 2010-2040 - current climate (based on the averaged output of 7 GCM models under Greenhouse Gas Emission Scenario A2)
Metadataclose[x]
West Asia and Egypt. Change in the share of summer precipitation 2010-2040 - current climate
Baseline data to assist development agencies in planning for adaptation strategies to climate change
West Asia and Egypt. Change in the share of summer precipitation 2010-2040 - current climate (based on the averaged output of 7 GCM models under Greenhouse Gas Emission Scenario A2)
International Center for Agricultural Research in the Dry Areas (ICARDA)
2010
climate change, downscaling, GCM, precipitation, emission scenario A2
West Asia, Egypt, Israel, Jordan, Lebanon, Occupied Palestinian Territories, Syria
15.329752
46.013085
44.627669
16.736002
D_WGS_1984
WGS_1984
6378137.000000
298.257224

West Asia and Egypt. Change in the share of spring precipitation 2010-2040 - current climate
West Asia and Egypt. Change in the share of spring precipitation 2010-2040 - current climate, GHG scenario A1b
Metadataclose[x]
West Asia and Egypt. Change in the share of spring precipitation 2010-2040 - current climate
Baseline data to assist development agencies in planning for adaptation strategies to climate change
West Asia and Egypt. Change in the share of spring precipitation 2010-2040 - current climate, GHG scenario A1b
International Center for Agricultural Research in the Dry Areas (ICARDA)
2010
climate change, downscaling, GCM, precipitation, emission scenario A1b
West Asia, Egypt, Israel, Jordan, Lebanon, Occupied Palestinian Territories, Syria
15.329752
46.013085
44.627669
16.736002
D_WGS_1984
WGS_1984
6378137.000000
298.257224

West Asia and Egypt. Change in the share of spring precipitation 2010-2040 - current climate
West Asia and Egypt. Change in the share of spring precipitation 2010-2040 - current climate (based on the averaged output of 7 GCM models under Greenhouse Gas Emission Scenario A2)
Metadataclose[x]
West Asia and Egypt. Change in the share of spring precipitation 2010-2040 - current climate
Baseline data to assist development agencies in planning for adaptation strategies to climate change
West Asia and Egypt. Change in the share of spring precipitation 2010-2040 - current climate (based on the averaged output of 7 GCM models under Greenhouse Gas Emission Scenario A2)
International Center for Agricultural Research in the Dry Areas (ICARDA)
2010
climate change, downscaling, GCM, precipitation, emission scenario A2
West Asia, Egypt, Israel, Jordan, Lebanon, Occupied Palestinian Territories, Syria
15.329752
46.013085
44.627669
16.736002
D_WGS_1984
WGS_1984
6378137.000000
298.257224

West Asia and Egypt. Change in the share of spring precipitation 2010-2040 - current climate
West Asia and Egypt. Change in the share of spring precipitation 2010-2040 - current climate (based on the averaged output of 7 GCM models under Greenhouse Gas Emission Scenario A2)
Metadataclose[x]
West Asia and Egypt. Change in the share of spring precipitation 2010-2040 - current climate
Baseline data to assist development agencies in planning for adaptation strategies to climate change
West Asia and Egypt. Change in the share of spring precipitation 2010-2040 - current climate (based on the averaged output of 7 GCM models under Greenhouse Gas Emission Scenario A2)
International Center for Agricultural Research in the Dry Areas (ICARDA)
2010
climate change, downscaling, GCM, precipitation, emission scenario A2
West Asia, Egypt, Israel, Jordan, Lebanon, Occupied Palestinian Territories, Syria
15.329752
46.013085
44.627669
16.736002
D_WGS_1984
WGS_1984
6378137.000000
298.257224

West Asia and Egypt. Change in the share of autumn precipitation 2010-2040 - current climate
West Asia and Egypt. Change in the share of autumn precipitation 2010-2040 - current climate, GHG scenario A1b
Metadataclose[x]
West Asia and Egypt. Change in the share of autumn precipitation 2010-2040 - current climate
Baseline data to assist development agencies in planning for adaptation strategies to climate change
West Asia and Egypt. Change in the share of autumn precipitation 2010-2040 - current climate, GHG scenario A1b
International Center for Agricultural Research in the Dry Areas (ICARDA)
2010
climate change, downscaling, GCM, precipitation, emission scenario A1b
West Asia, Egypt, Israel, Jordan, Lebanon, Occupied Palestinian Territories, Syria
15.329752
46.013085
44.627669
16.736002
D_WGS_1984
WGS_1984
6378137.000000
298.257224

West Asia and Egypt. Annual mean precipitation 2010-2040
West Asia and Egypt. Annual mean precipitation 2010-2040 (based on the averaged output of 7 GCM models under Greenhouse Gas Emission Scenario A1b)
Metadataclose[x]
West Asia and Egypt. Annual mean precipitation 2010-2040
Baseline data to assist development agencies in planning for adaptation strategies to climate change
West Asia and Egypt. Annual mean precipitation 2010-2040 (based on the averaged output of 7 GCM models under Greenhouse Gas Emission Scenario A1b)
International Center for Agricultural Research in the Dry Areas (ICARDA)
2010
climate change, downscaling, GCM, precipitation, emission scenario A1b
West Asia, Egypt, Israel, Jordan, Lebanon, Occupied Palestinian Territories, Syria
15.329752
46.013085
44.627669
16.736002
D_WGS_1984
WGS_1984
6378137.000000
298.257224

West Asia and Egypt. Annual mean precipitation 2010-2040
West Asia and Egypt. Annual mean precipitation 2010-2040 (based on the averaged output of 7 GCM models under Greenhouse Gas Emission Scenario A2)
Metadataclose[x]
West Asia and Egypt. Annual mean precipitation 2010-2040
Baseline data to assist development agencies in planning for adaptation strategies to climate change
West Asia and Egypt. Annual mean precipitation 2010-2040 (based on the averaged output of 7 GCM models under Greenhouse Gas Emission Scenario A2)
International Center for Agricultural Research in the Dry Areas (ICARDA)
2010
climate change, downscaling, GCM, precipitation, emission scenario A2
West Asia, Egypt, Israel, Jordan, Lebanon, Occupied Palestinian Territories, Syria
15.329752
46.013085
44.627669
16.736002
D_WGS_1984
WGS_1984
6378137.000000
298.257224

West Asia and Egypt. Annual mean potential evapotranspiration 2010-2040, GHG scenario A1b
West Asia and Egypt. Annual mean potential evapotranspiration 2010-2040 (based on the averaged output of 7 GCM models under Greenhouse Gas Emission Scenario A1b)
Metadataclose[x]
West Asia and Egypt. Annual mean potential evapotranspiration 2010-2040, GHG scenario A1b
Baseline data to assist development agencies in planning for adaptation strategies to climate change
West Asia and Egypt. Annual mean potential evapotranspiration 2010-2040 (based on the averaged output of 7 GCM models under Greenhouse Gas Emission Scenario A1b)
International Center for Agricultural Research in the Dry Areas (ICARDA)
2010
climate change, downscaling, GCM, potential evapotranspiration, emission scenario A1b
West Asia, Egypt, Israel, Jordan, Lebanon, Occupied Palestinian Territories, Syria
22.000000
46.000000
40.000000
18.000000
D_WGS_1984
WGS_1984
6378137.000000
298.257224

West Asia and Egypt. Annual average of the monthly minimum temperature 2010-2040
West Asia and Egypt. Annual average of the monthly minimum temperature 2010-2040 (based on the averaged output of 7 GCM models under Greenhouse Gas Emission Scenario A1b)
Metadataclose[x]
West Asia and Egypt. Annual average of the monthly minimum temperature 2010-2040
Baseline data to assist development agencies in planning for adaptation strategies to climate change
West Asia and Egypt. Annual average of the monthly minimum temperature 2010-2040 (based on the averaged output of 7 GCM models under Greenhouse Gas Emission Scenario A1b)
International Center for Agricultural Research in the Dry Areas (ICARDA)
2010
climate change, downscaling, GCM, temperature, emission scenario A1b
West Asia, Egypt, Israel, Jordan, Lebanon, Occupied Palestinian Territories, Syria
22.000000
46.000000
40.000000
18.000000
D_WGS_1984
WGS_1984
6378137.000000
298.257224

West Asia and Egypt. Annual average of the monthly maximum temperature 2010-2040
West Asia and Egypt. Annual average of the monthly maximum temperature 2010-2040 (based on the averaged output of 7 GCM models under Greenhouse Gas Emission Scenario A1b)
Metadataclose[x]
West Asia and Egypt. Annual average of the monthly maximum temperature 2010-2040
Baseline data to assist development agencies in planning for adaptation strategies to climate change
West Asia and Egypt. Annual average of the monthly maximum temperature 2010-2040 (based on the averaged output of 7 GCM models under Greenhouse Gas Emission Scenario A1b)
International Center for Agricultural Research in the Dry Areas (ICARDA)
2010
climate change, downscaling, GCM, temperature, emission scenario A1b
West Asia, Egypt, Israel, Jordan, Lebanon, Occupied Palestinian Territories, Syria
22.000000
46.000000
40.000000
18.000000
D_WGS_1984
WGS_1984
6378137.000000
298.257224

West Asia and Egypt. Annual aridity index 2010-2040
West Asia and Egypt. Annual aridity index 2010-2040 (based on the averaged output of 7 GCM models under Greenhouse Gas Emission Scenario A1b)
Metadataclose[x]
West Asia and Egypt. Annual aridity index 2010-2040
Baseline data to assist development agencies in planning for adaptation strategies to climate change
West Asia and Egypt. Annual aridity index 2010-2040 (based on the averaged output of 7 GCM models under Greenhouse Gas Emission Scenario A1b)
International Center for Agricultural Research in the Dry Areas (ICARDA)
2010
climate change, downscaling, GCM, aridity index, emission scenario A1b
West Asia, Egypt, Israel, Jordan, Lebanon, Occupied Palestinian Territories, Syria
22.000000
46.000000
40.000000
18.000000
D_WGS_1984
WGS_1984
6378137.000000
298.257224

West Asia and Egypt. Absolute change of the annual minimum temperature 201020-
West Asia and Egypt. Absolute change of the annual minimum temperature 201020-2040 (based on the averaged output of 7 GCM models under Greenhouse Gas Emission Scenario A1b)
Metadataclose[x]
West Asia and Egypt. Absolute change of the annual minimum temperature 201020-
Baseline data to assist development agencies in planning for adaptation strategies to climate change
West Asia and Egypt. Absolute change of the annual minimum temperature 201020-2040 (based on the averaged output of 7 GCM models under Greenhouse Gas Emission Scenario A1b)
International Center for Agricultural Research in the Dry Areas (ICARDA)
2010
climate change, downscaling, GCM, temperature, emission scenario A1b
West Asia, Egypt, Israel, Jordan, Lebanon, Occupied Palestinian Territories, Syria
22.000000
46.000000
40.000000
18.000000
D_WGS_1984
WGS_1984
6378137.000000
298.257224

West Asia and Egypt. Absolute change of the annual mean temperature 2010-2040
West Asia and Egypt. Absolute change of the annual mean temperature 2010-2040 (based on the averaged output of 7 GCM models under Greenhouse Gas Emission Scenario A1b)
Metadataclose[x]
West Asia and Egypt. Absolute change of the annual mean temperature 2010-2040
Baseline data to assist development agencies in planning for adaptation strategies to climate change
West Asia and Egypt. Absolute change of the annual mean temperature 2010-2040 (based on the averaged output of 7 GCM models under Greenhouse Gas Emission Scenario A1b)
Eddy De Pauw, International Center for Agricultural Research in the Dry Areas (ICARDA)
2010
climate change, downscaling, GCM, temperature, emission scenario A1b
West Asia, Egypt, Israel, Jordan, Lebanon, Occupied Palestinian Territories, Syria
22.000000
46.000000
40.000000
18.000000
D_WGS_1984
WGS_1984
6378137.000000
298.257224

West Asia and Egypt. Absolute change of the annual maximum temperature 2010-2040
West Asia and Egypt. Absolute change of the annual maximum temperature 2010-2040 (based on the averaged output of 7 GCM models under Greenhouse Gas Emission Scenario A1b)
Metadataclose[x]
West Asia and Egypt. Absolute change of the annual maximum temperature 2010-2040
Baseline data to assist development agencies in planning for adaptation strategies to climate change
West Asia and Egypt. Absolute change of the annual maximum temperature 2010-2040 (based on the averaged output of 7 GCM models under Greenhouse Gas Emission Scenario A1b)
International Center for Agricultural Research in the Dry Areas (ICARDA)
2010
climate change, downscaling, GCM, precipitation, emission scenario A1b
West Asia, Egypt, Israel, Jordan, Lebanon, Occupied Palestinian Territories, Syria
22.000000
46.000000
40.000000
18.000000
D_WGS_1984
WGS_1984
6378137.000000
298.257224

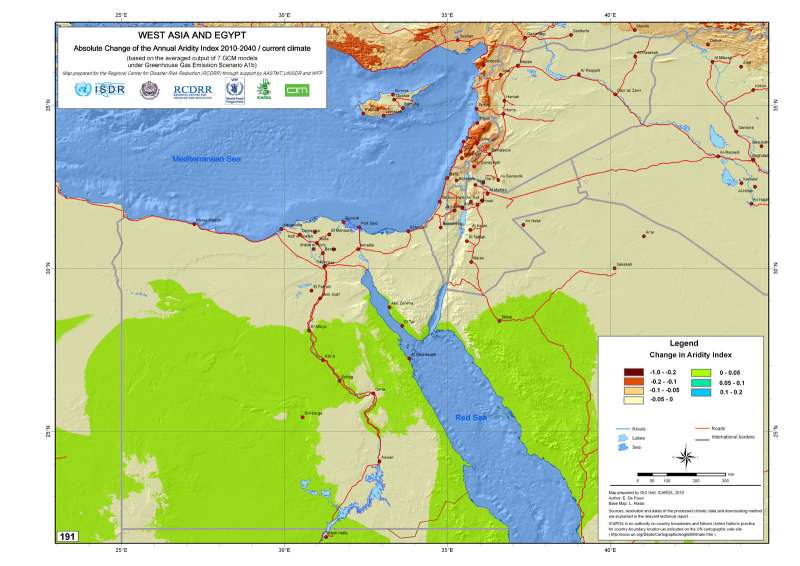
West Asia and Egypt. Absolute change of annual aridity index 2010-2040/ current climate
West Asia and Egypt. Absolute change of annual aridity index 2010-2040/ current climate
Metadataclose[x]
West Asia and Egypt. Absolute change of annual aridity index 2010-2040/ current climate
Baseline data to assist development agencies in planning for adaptation strategies to climate change
West Asia and Egypt. Absolute change of annual aridity index 2010-2040/ current climate
International Center for Agricultural Research in the Dry Areas (ICARDA)
2010
climate change, downscaling, GCM, emission scenario A1b, aridity index
West Asia, Egypt, Israel, Jordan, Lebanon, Occupied Palestinian Territories, Syria
22.000000
46.000000
40.000000
18.000000
D_WGS_1984
WGS_1984
6378137.000000
298.257224

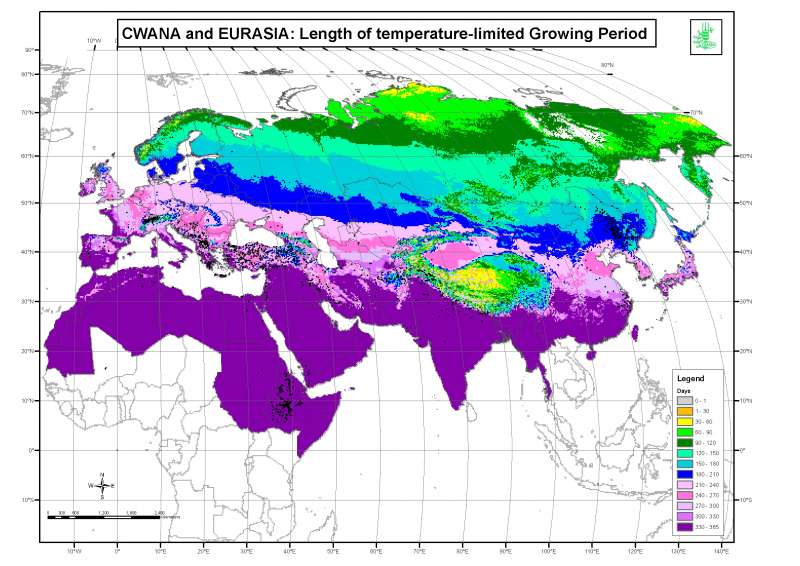
Temperature-limited Growing Period in CWANA and Eurasia
Total length of temperature-limited growing periods in the Central and West Asia - North Africa and Eurasia regions
Metadataclose[x]
Temperature-limited Growing Period in CWANA and Eurasia
Building a new eco-climatic database was established consisting of GIS layers of soil and climatic parameters at 1 km resolution, covering the entire CWANA and Eurasia region.
Total length of temperature-limited growing periods in the Central and West Asia - North Africa and Eurasia regions
International Center for Agricultural Research in the Dry Areas (ICARDA)
2008
climate, moisture-limited growing period
CWANA, Eurasia
-0.000181
0.001907
0.000728
-0.000016
D_WGS_1984
WGS_1984
6378137.000000
298.257224

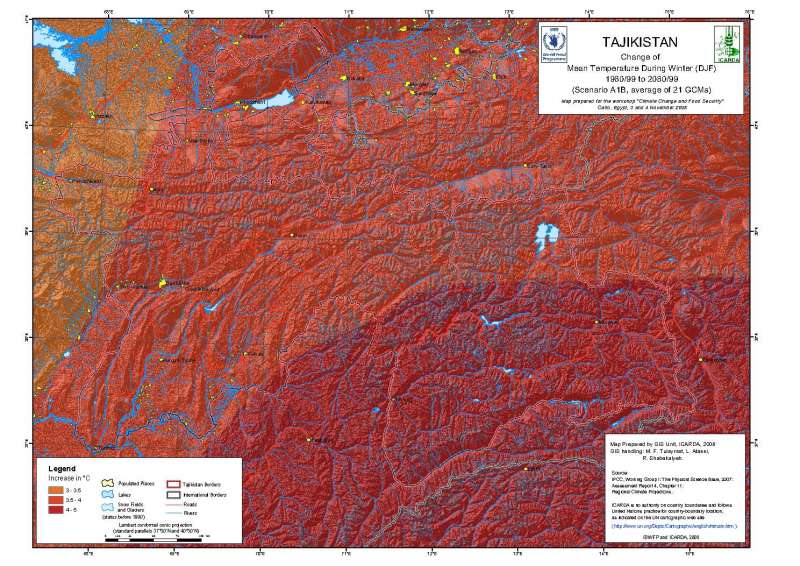
Tajikistan: Winter Temperature Change 2080-2099
Change of the mean temperature in �������������������������������°C during winter (December-January-February) for the period 2080 to 2099 in relation to the period 1980 to 1999 (scenario A1B, using the average of predictions by 21 GCMs).
Metadataclose[x]
Tajikistan: Winter Temperature Change 2080-2099
WFP Workshop on "Climate Change and Food Security", Cairo, Egypt, 3-4 November 2008
Change of the mean temperature in �������������������������������°C during winter (December-January-February) for the period 2080 to 2099 in relation to the period 1980 to 1999 (scenario A1B, using the average of predictions by 21 GCMs).
International Center for Agricultural Research in the Dry Areas (ICARDA)
2008
Future climate, Temperature, WFP
CWANA, Tajikistan
67.007500
75.991663
41.991664
36.007500
D_WGS_1984
WGS_1984
6378137.000000
298.257224

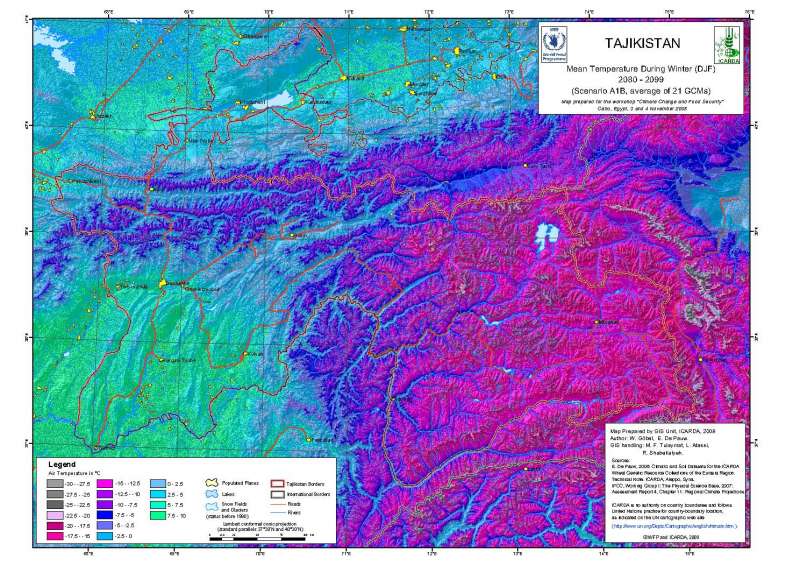
Tajikistan: Winter Precipitation Temperature 2080-2099
Mean temperature during winter (December-January-February) in �������������������������������°C for the period 2080 to 2099, scenario A1B, using the average of predictions by 21 GCMs.
Metadataclose[x]
Tajikistan: Winter Precipitation Temperature 2080-2099
WFP Workshop on "Climate Change and Food Security", Cairo, Egypt, 3-4 November 2008
Mean temperature during winter (December-January-February) in �������������������������������°C for the period 2080 to 2099, scenario A1B, using the average of predictions by 21 GCMs.
International Center for Agricultural Research in the Dry Areas (ICARDA)
2008
Future climate, Temperature, WFP
CWANA, Tajikistan
66.995644
75.988140
42.009941
36.017443
D_WGS_1984
WGS_1984
6378137.000000
298.257224