


Geoinformatics Solutions for Integrated Agro-ecosystems Research
GIS Data
Maps in: Climate
 Changes in the Annual Potential Evapo Transpiration from current conditions to 2011-2040 scenario A2")
Central Asia and Xingjiang Province (China) Changes in the Annual Potential Evapo Transpiration from current conditions to 2011-2040 scenario A2
Relative change in annual PET 2011-2040/current climate (based on the averaged output of 7 GCM models under Greenhouse Gas Emission Scenario A2)
Metadataclose[x]
Central Asia and Xingjiang Province (China) Changes in the Annual Potential Evapo Transpiration from current conditions to 2011-2040 scenario A2
Baseline data to assist development agencies in planning for adaptation strategies to climate change
Relative change in annual PET 2011-2040/current climate (based on the averaged output of 7 GCM models under Greenhouse Gas Emission Scenario A2)
International Center for Agricultural Research in the Dry Areas (ICARDA)
2010
Tajikistan, Turkmenistan, Kazakhstan, Uzbekistan, Kyrgyzstan, Xingjiang Province
51.218469686
103.047567786
52.69812595
32.817056204
D_WGS_1984
WGS_1984
6378137.000000
298.257224
 Annual maximum temperature 2011-2040 A1b Scenario")
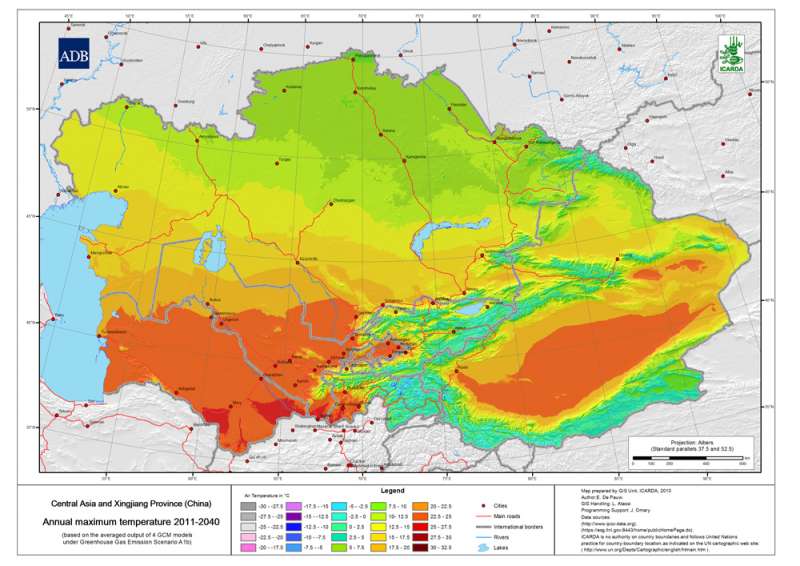
Central Asia and Xingjiang Province (China) Annual maximum temperature 2011-2040 A1b Scenario
Annual average of the monthly maximum temperature 2011-2040 (based on the averaged output of 7 GCM models under Greenhouse Gas Emission Scenario A1b)
Metadataclose[x]
Central Asia and Xingjiang Province (China) Annual maximum temperature 2011-2040 A1b Scenario
Baseline data to assist development agencies in planning for adaptation strategies to climate change
Annual average of the monthly maximum temperature 2011-2040 (based on the averaged output of 7 GCM models under Greenhouse Gas Emission Scenario A1b)
International Center for Agricultural Research in the Dry Areas (ICARDA)
2010
Tajikistan, Turkmenistan, Kazakhstan, Uzbekistan, Kyrgyzstan, Xingjiang Province
51.218469686
103.047567786
52.69812595
32.817056204
D_WGS_1984
WGS_1984
6378137.000000
298.257224
 Changes in the Annual Potential Evapo Transpiration from current conditions to 2070-2100 scenario A2")
Central Asia and Xingjiang Province (China) Changes in the Annual Potential Evapo Transpiration from current conditions to 2070-2100 scenario A2
Relative change in annual PET 2070-2100/current climate (based on the averaged output of 7 GCM models under Greenhouse Gas Emission Scenario A2)
Metadataclose[x]
Central Asia and Xingjiang Province (China) Changes in the Annual Potential Evapo Transpiration from current conditions to 2070-2100 scenario A2
Baseline data to assist development agencies in planning for adaptation strategies to climate change
Relative change in annual PET 2070-2100/current climate (based on the averaged output of 7 GCM models under Greenhouse Gas Emission Scenario A2)
International Center for Agricultural Research in the Dry Areas (ICARDA)
2010
Tajikistan, Turkmenistan, Kazakhstan, Uzbekistan, Kyrgyzstan, Xingjiang Province
51.218469686
103.047567786
52.69812595
32.817056204
D_WGS_1984
WGS_1984
6378137.000000
298.257224
 Annual maximum temperature 2071-2100 A1b Scenario")
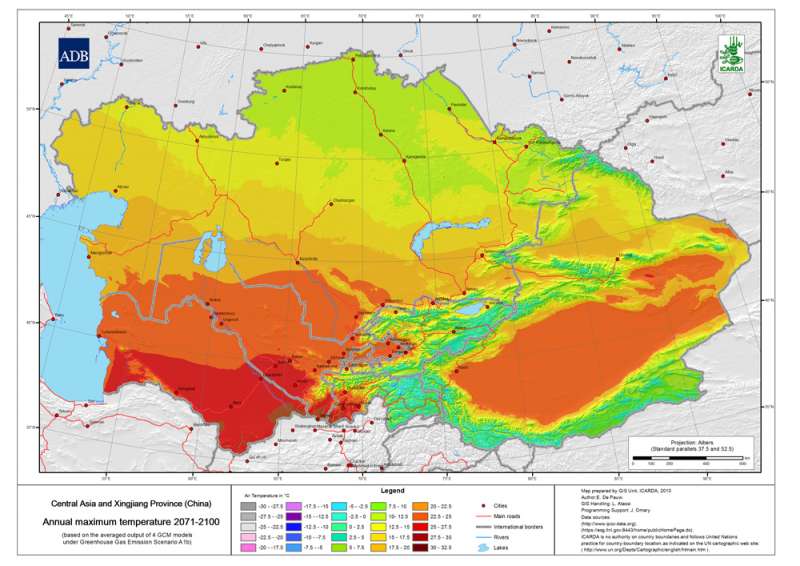
Central Asia and Xingjiang Province (China) Annual maximum temperature 2071-2100 A1b Scenario
Annual average of the monthly maximum temperature 2071-2100 (based on the averaged output of 7 GCM models under Greenhouse Gas Emission Scenario A1b)
Metadataclose[x]
Central Asia and Xingjiang Province (China) Annual maximum temperature 2071-2100 A1b Scenario
Baseline data to assist development agencies in planning for adaptation strategies to climate change
Annual average of the monthly maximum temperature 2071-2100 (based on the averaged output of 7 GCM models under Greenhouse Gas Emission Scenario A1b)
International Center for Agricultural Research in the Dry Areas (ICARDA)
2010
Tajikistan, Turkmenistan, Kazakhstan, Uzbekistan, Kyrgyzstan, Xingjiang Province
51.218469686
103.047567786
52.69812595
32.817056204
D_WGS_1984
WGS_1984
6378137.000000
298.257224
 Changes in the Annual maximum temperature from current conditions to 2041-2070 scenario A2")
Central Asia and Xingjiang Province (China) Changes in the Annual maximum temperature from current conditions to 2041-2070 scenario A2
Absolute change of the annual maximum temperature 2041-2070 (based on the averaged output of 7 GCM models under Greenhouse Gas Emission Scenario A2)
Metadataclose[x]
Central Asia and Xingjiang Province (China) Changes in the Annual maximum temperature from current conditions to 2041-2070 scenario A2
Baseline data to assist development agencies in planning for adaptation strategies to climate change
Absolute change of the annual maximum temperature 2041-2070 (based on the averaged output of 7 GCM models under Greenhouse Gas Emission Scenario A2)
International Center for Agricultural Research in the Dry Areas (ICARDA)
2010
Tajikistan, Turkmenistan, Kazakhstan, Uzbekistan, Kyrgyzstan, Xingjiang Province
51.218469686
103.047567786
52.69812595
32.817056204
D_WGS_1984
WGS_1984
6378137.000000
298.257224
 Annual mean precipitation 2011-2040 A2 Scenario")
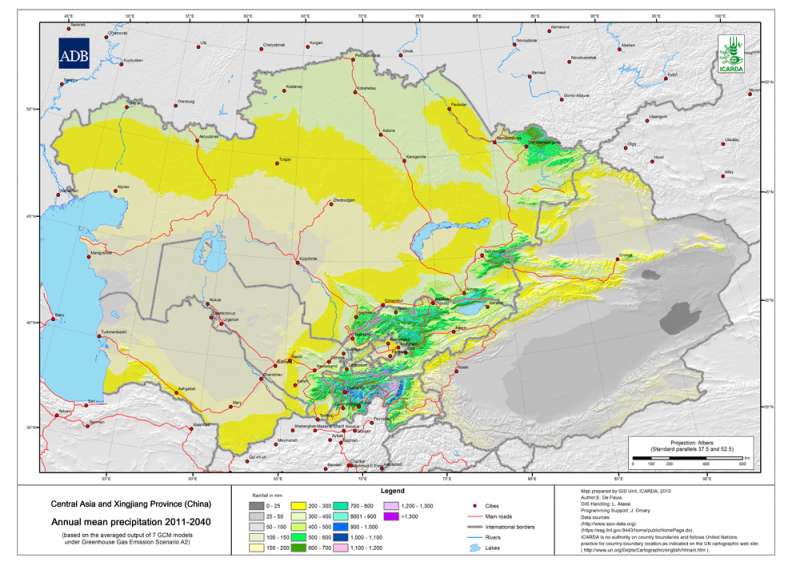
Central Asia and Xingjiang Province (China) Annual mean precipitation 2011-2040 A2 Scenario
Annual mean precipitation 2011-2040 (based on the averaged output of 7 GCM models under Greenhouse Gas Emission Scenario A2)
Metadataclose[x]
Central Asia and Xingjiang Province (China) Annual mean precipitation 2011-2040 A2 Scenario
An input layer to create the map of Changes in Annual mean precipitation of Central Asia
Annual mean precipitation 2011-2040 (based on the averaged output of 7 GCM models under Greenhouse Gas Emission Scenario A2)
International Center for Agricultural Research in the Dry Areas (ICARDA)
2010
Tajikistan, Turkmenistan, Kazakhstan, Uzbekistan, Kyrgyzstan, Xingjiang Province
51.218469686
103.047567786
52.69812595
32.817056204
D_WGS_1984
WGS_1984
6378137.000000
298.257224
 Changes in the Annual mean precipitation from current conditions to 2011-2040 scenario A2")
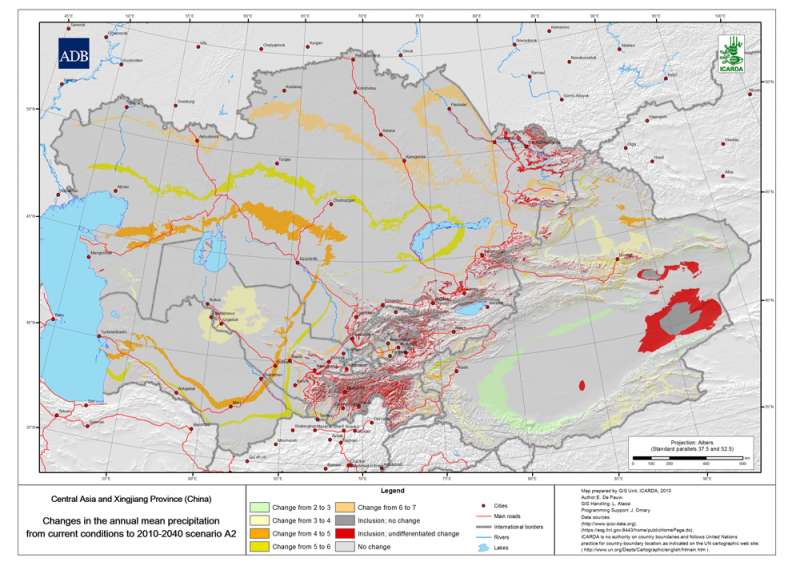
Central Asia and Xingjiang Province (China) Changes in the Annual mean precipitation from current conditions to 2011-2040 scenario A2
Relative precipitation change 2011-2040/current climate (based on the averaged output of 7 GCM models under Greenhouse Gas Emission Scenario A2)
Metadataclose[x]
Central Asia and Xingjiang Province (China) Changes in the Annual mean precipitation from current conditions to 2011-2040 scenario A2
Baseline data to assist development agencies in planning for adaptation strategies to climate change
Relative precipitation change 2011-2040/current climate (based on the averaged output of 7 GCM models under Greenhouse Gas Emission Scenario A2)
International Center for Agricultural Research in the Dry Areas (ICARDA)
2010
Tajikistan, Turkmenistan, Kazakhstan, Uzbekistan, Kyrgyzstan, Xingjiang Province
51.218469686
103.047567786
52.69812595
32.817056204
D_WGS_1984
WGS_1984
6378137.000000
298.257224
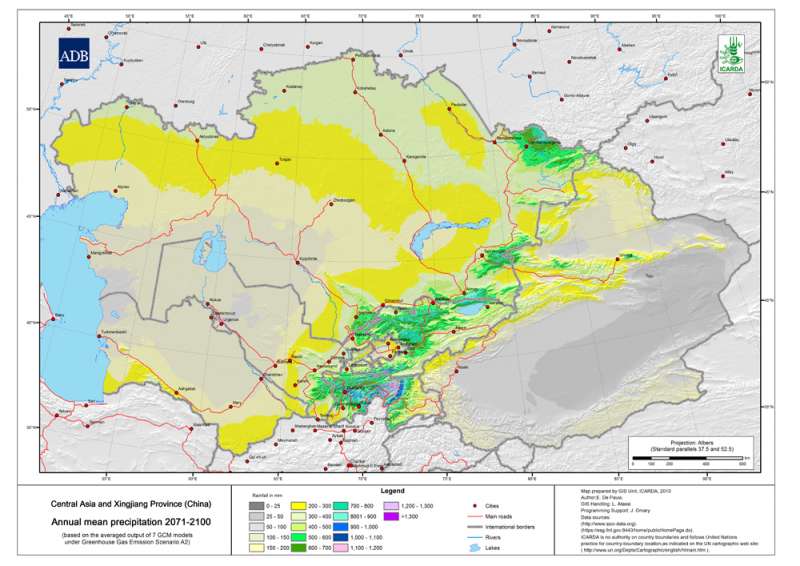
 Annual mean precipitation 2071-2100 A2 Scenario")
Central Asia and Xingjiang Province (China) Annual mean precipitation 2071-2100 A2 Scenario
Annual mean precipitation 2071-2100 (based on the averaged output of 7 GCM models under Greenhouse Gas Emission Scenario A2)
Metadataclose[x]
Central Asia and Xingjiang Province (China) Annual mean precipitation 2071-2100 A2 Scenario
An input layer to create the map of Changes in Annual mean precipitation of Central Asia
Annual mean precipitation 2071-2100 (based on the averaged output of 7 GCM models under Greenhouse Gas Emission Scenario A2)
International Center for Agricultural Research in the Dry Areas (ICARDA)
2010
Tajikistan, Turkmenistan, Kazakhstan, Uzbekistan, Kyrgyzstan, Xingjiang Province
51.218469686
103.047567786
52.69812595
32.817056204
D_WGS_1984
WGS_1984
6378137.000000
298.257224
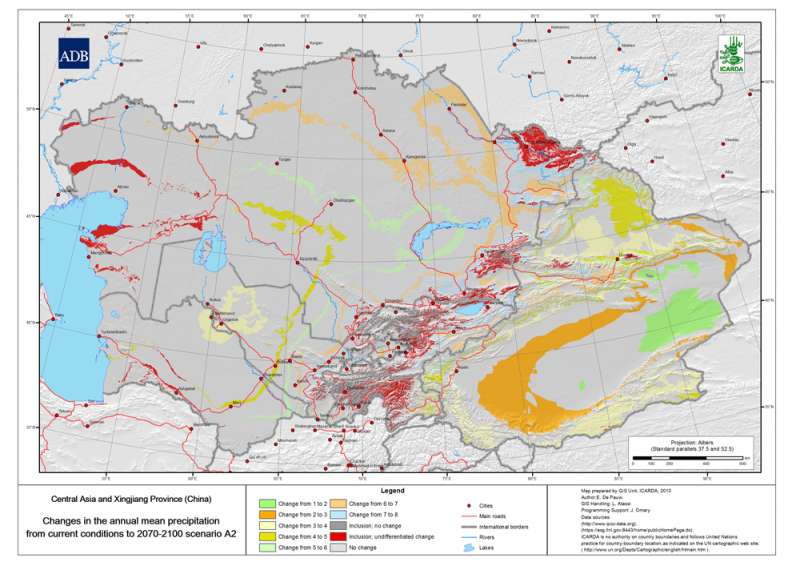
 Changes in the Annual mean precipitation from current conditions to 2070-2100 scenario A2")
Central Asia and Xingjiang Province (China) Changes in the Annual mean precipitation from current conditions to 2070-2100 scenario A2
Relative precipitation change 2070-2100/current climate (based on the averaged output of 7 GCM models under Greenhouse Gas Emission Scenario A2)
Metadataclose[x]
Central Asia and Xingjiang Province (China) Changes in the Annual mean precipitation from current conditions to 2070-2100 scenario A2
Baseline data to assist development agencies in planning for adaptation strategies to climate change
Relative precipitation change 2070-2100/current climate (based on the averaged output of 7 GCM models under Greenhouse Gas Emission Scenario A2)
International Center for Agricultural Research in the Dry Areas (ICARDA)
2010
Tajikistan, Turkmenistan, Kazakhstan, Uzbekistan, Kyrgyzstan, Xingjiang Province
51.218469686
103.047567786
52.69812595
32.817056204
D_WGS_1984
WGS_1984
6378137.000000
298.257224
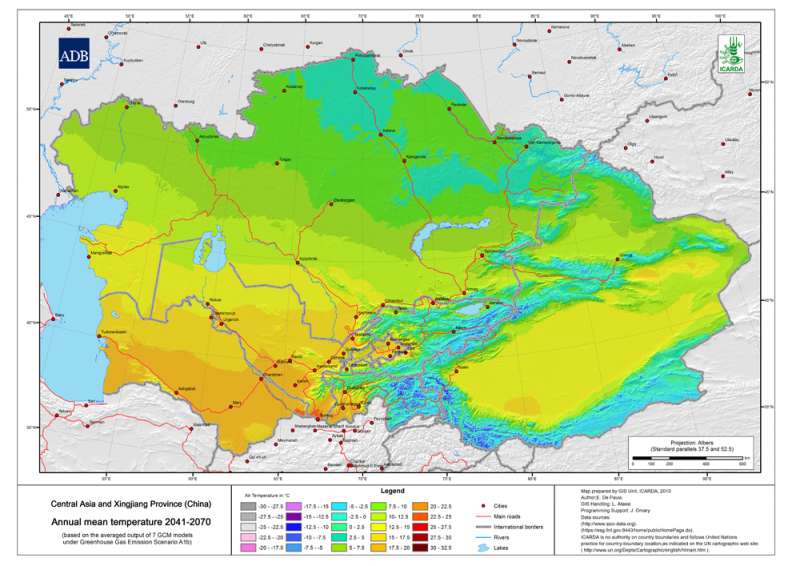
 Annual mean temperature 2041-2070 A1b Scenario")
Central Asia and Xingjiang Province (China) Annual mean temperature 2041-2070 A1b Scenario
Mean annual temperature 2041-2070 (based on the averaged output of 7 GCM models under Greenhouse Gas Emission Scenario A1b)
Metadataclose[x]
Central Asia and Xingjiang Province (China) Annual mean temperature 2041-2070 A1b Scenario
An input layer to create the map of Changes in Annual mean temperature of Central Asia
Mean annual temperature 2041-2070 (based on the averaged output of 7 GCM models under Greenhouse Gas Emission Scenario A1b)
International Center for Agricultural Research in the Dry Areas (ICARDA)
2010
Tajikistan, Turkmenistan, Kazakhstan, Uzbekistan, Kyrgyzstan, Xingjiang Province
51.218469686
103.047567786
52.69812595
32.817056204
D_WGS_1984
WGS_1984
6378137.000000
298.257224