


Geoinformatics Solutions for Integrated Agro-ecosystems Research
GIS Data
Maps in: Climate

West Asia and Egypt. Monthly mean temperature 2010-2040: July
West Asia and Egypt. Monthly mean temperature 2010-2040: July (based on the averaged output of 7 GCM models under Greenhouse Gas Emission Scenario A1b)
Metadataclose[x]
West Asia and Egypt. Monthly mean temperature 2010-2040: July
Baseline data to assist development agencies in planning for adaptation strategies to climate change
West Asia and Egypt. Monthly mean temperature 2010-2040: July (based on the averaged output of 7 GCM models under Greenhouse Gas Emission Scenario A1b)
International Center for Agricultural Research in the Dry Areas (ICARDA)
2010
climate change, downscaling, GCM, temperature, emission scenario A1b
West Asia, Egypt, Israel, Jordan, Lebanon, Occupied Palestinian Territories, Syria
22.000000
46.000000
40.000000
18.000000
D_WGS_1984
WGS_1984
6378137.000000
298.257224

West Asia and Egypt. Monthly mean temperature 2010-2040: July
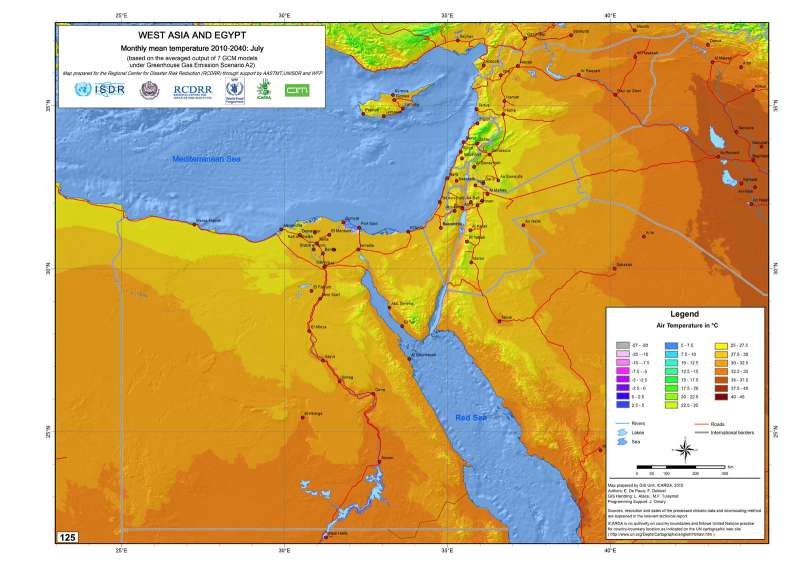
West Asia and Egypt. Monthly mean temperature 2010-2040: July (based on the averaged output of 7 GCM models under Greenhouse Gas Emission Scenario A2)
Metadataclose[x]
West Asia and Egypt. Monthly mean temperature 2010-2040: July
Baseline data to assist development agencies in planning for adaptation strategies to climate change
West Asia and Egypt. Monthly mean temperature 2010-2040: July (based on the averaged output of 7 GCM models under Greenhouse Gas Emission Scenario A2)
International Center for Agricultural Research in the Dry Areas (ICARDA)
2010
climate change, downscaling, GCM, temperature, emission scenario A2
West Asia, Egypt, Israel, Jordan, Lebanon, Occupied Palestinian Territories, Occupied Palestinian Territories
22.000000
46.000000
40.000000
18.000000
D_WGS_1984
WGS_1984
6378137.000000
298.257224

West Asia and Egypt. Monthly mean temperature 2010-2040: June
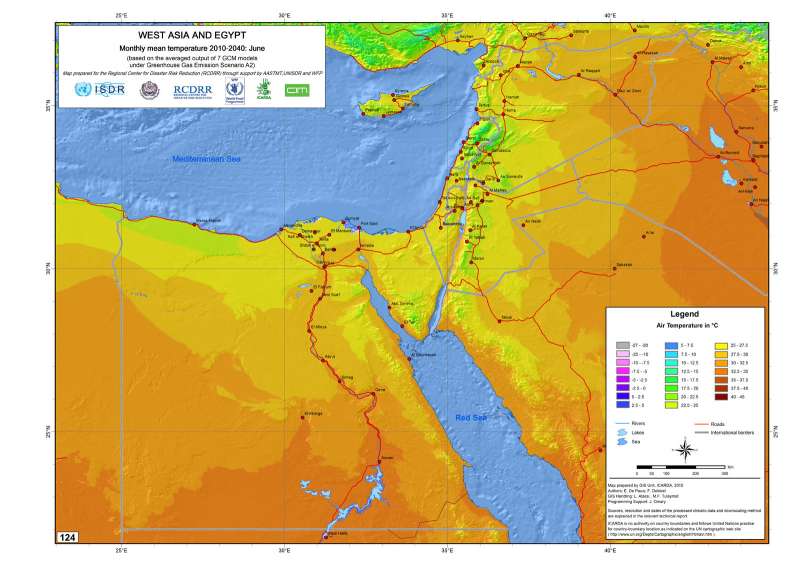
West Asia and Egypt. Monthly mean temperature 2010-2040: June (based on the averaged output of 7 GCM models under Greenhouse Gas Emission Scenario A1b)
Metadataclose[x]
West Asia and Egypt. Monthly mean temperature 2010-2040: June
Baseline data to assist development agencies in planning for adaptation strategies to climate change
West Asia and Egypt. Monthly mean temperature 2010-2040: June (based on the averaged output of 7 GCM models under Greenhouse Gas Emission Scenario A1b)
International Center for Agricultural Research in the Dry Areas (ICARDA)
2010
climate change, downscaling, GCM, temperature, emission scenario A1b
West Asia, Egypt, Israel, Jordan, Lebanon, Occupied Palestinian Territories, Syria
22.000000
46.000000
40.000000
18.000000
D_WGS_1984
WGS_1984
6378137.000000
298.257224

West Asia and Egypt. Monthly mean temperature 2010-2040: June
West Asia and Egypt. Monthly mean temperature 2010-2040: June (based on the averaged output of 7 GCM models under Greenhouse Gas Emission Scenario A2)
Metadataclose[x]
West Asia and Egypt. Monthly mean temperature 2010-2040: June
Baseline data to assist development agencies in planning for adaptation strategies to climate change
West Asia and Egypt. Monthly mean temperature 2010-2040: June (based on the averaged output of 7 GCM models under Greenhouse Gas Emission Scenario A2)
International Center for Agricultural Research in the Dry Areas (ICARDA)
2010
climate change, climate change, GCM, temperature, emission scenario A2
West Asia, Egypt, Israel, Jordan, Lebanon, Occupied Palestinian Territories, Syria
22.000000
46.000000
40.000000
18.000000
D_WGS_1984
WGS_1984
6378137.000000
298.257224

West Asia and Egypt. Monthly mean temperature 2010-2040: March
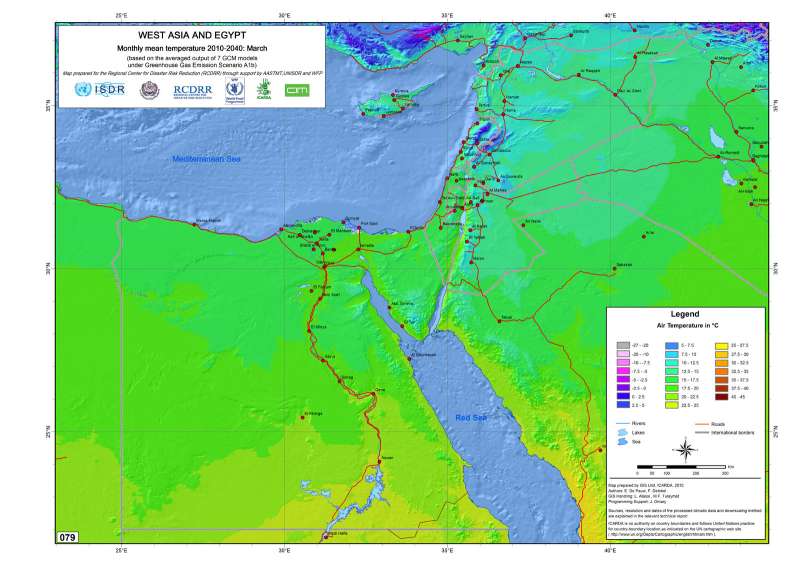
West Asia and Egypt. Monthly mean temperature 2010-2040:March (based on the averaged output of 7 GCM models under Greenhouse Gas Emission Scenario A1b)
Metadataclose[x]
West Asia and Egypt. Monthly mean temperature 2010-2040: March
Baseline data to assist development agencies in planning for adaptation strategies to climate change
West Asia and Egypt. Monthly mean temperature 2010-2040:March (based on the averaged output of 7 GCM models under Greenhouse Gas Emission Scenario A1b)
International Center for Agricultural Research in the Dry Areas (ICARDA)
2010
climate change, downscaling, GCM, temperature, emission scenario A1b
West Asia, Egypt, Israel, Jordan, Lebanon, Occupied Palestinian Territories, Syria
22.000000
46.000000
40.000000
18.000000
D_WGS_1984
WGS_1984
6378137.000000
298.257224

West Asia and Egypt. Monthly mean temperature 2010-2040: March
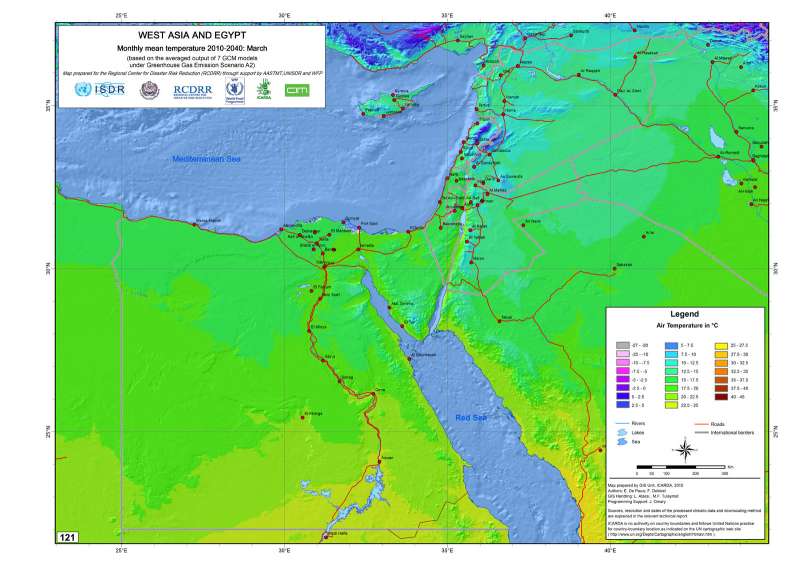
West Asia and Egypt. Monthly mean temperature 2010-2040: March (based on the averaged output of 7 GCM models under Greenhouse Gas Emission Scenario A2)
Metadataclose[x]
West Asia and Egypt. Monthly mean temperature 2010-2040: March
Baseline data to assist development agencies in planning for adaptation strategies to climate change
West Asia and Egypt. Monthly mean temperature 2010-2040: March (based on the averaged output of 7 GCM models under Greenhouse Gas Emission Scenario A2)
International Center for Agricultural Research in the Dry Areas (ICARDA)
2010
climate change, downscaling, GCM, temperature, emission scenario A2
West Asia, Egypt, Israel, Jordan, Lebanon, Occupied Palestinian Territories, Syria
22.000000
46.000000
40.000000
18.000000
D_WGS_1984
WGS_1984
6378137.000000
298.257224

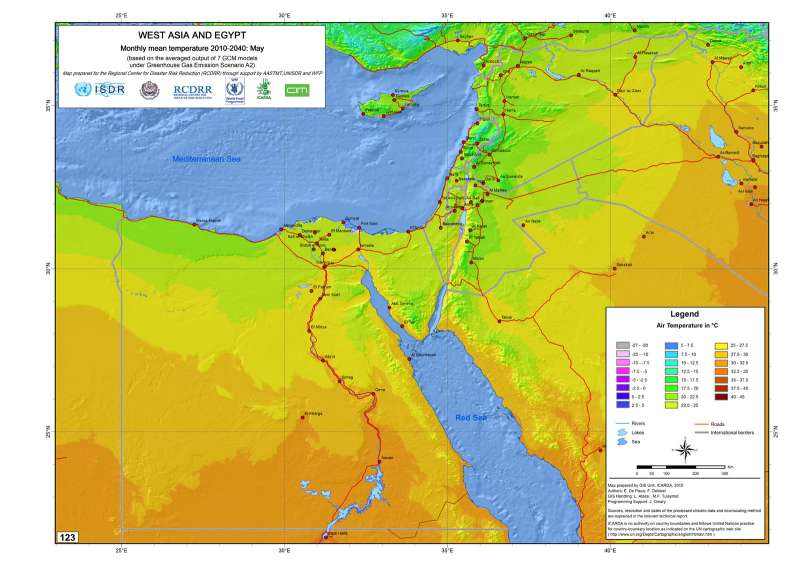
West Asia and Egypt. Monthly mean temperature 2010-2040: May
West Asia and Egypt. Monthly mean temperature 2010-2040: May (based on the averaged output of 7 GCM models under Greenhouse Gas Emission Scenario A1b)
Metadataclose[x]
West Asia and Egypt. Monthly mean temperature 2010-2040: May
Baseline data to assist development agencies in planning for adaptation strategies to climate change
West Asia and Egypt. Monthly mean temperature 2010-2040: May (based on the averaged output of 7 GCM models under Greenhouse Gas Emission Scenario A1b)
International Center for Agricultural Research in the Dry Areas (ICARDA)
2010
climate change, downscaling, GCM, temperature, emission scenario A1b
West Asia, Egypt, Israel, Jordan, Lebanon, Occupied Palestinian Territories, Syria
22.000000
46.000000
40.000000
18.000000
D_WGS_1984
WGS_1984
6378137.000000
298.257224

West Asia and Egypt. Monthly mean temperature 2010-2040: May
West Asia and Egypt. Monthly mean temperature 2010-2040: May (based on the averaged output of 7 GCM models under Greenhouse Gas Emission Scenario A2)
Metadataclose[x]
West Asia and Egypt. Monthly mean temperature 2010-2040: May
Baseline data to assist development agencies in planning for adaptation strategies to climate change
West Asia and Egypt. Monthly mean temperature 2010-2040: May (based on the averaged output of 7 GCM models under Greenhouse Gas Emission Scenario A2)
International Center for Agricultural Research in the Dry Areas (ICARDA)
2010
climate change, downscaling, GCM, temperature, emission scenario A2
West Asia, Egypt, Israel, Jordan, Lebanon, Occupied Palestinian Territories, Syria
22.000000
46.000000
40.000000
18.000000
D_WGS_1984
WGS_1984
6378137.000000
298.257224

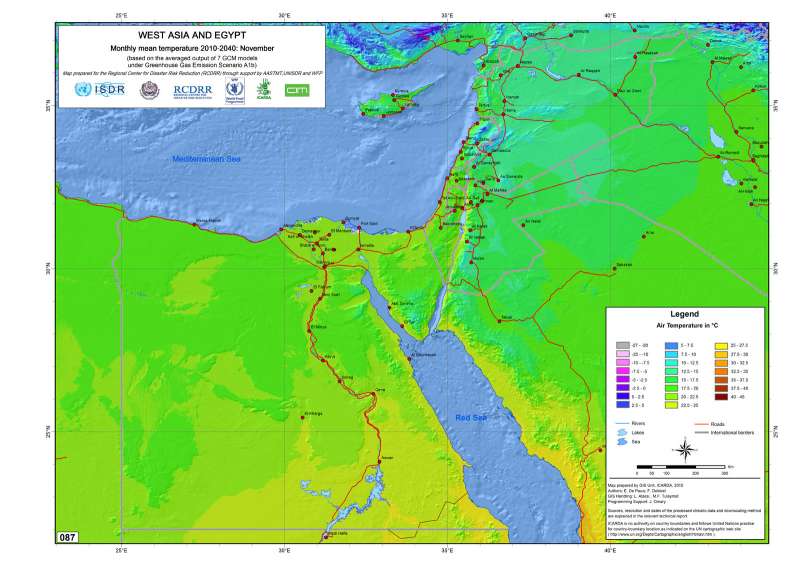
West Asia and Egypt. Monthly mean temperature 2010-2040: November
West Asia and Egypt. Monthly mean temperature 2010-2040: November (based on the averaged output of 7 GCM models under Greenhouse Gas Emission Scenario A1b)
Metadataclose[x]
West Asia and Egypt. Monthly mean temperature 2010-2040: November
Baseline data to assist development agencies in planning for adaptation strategies to climate change
West Asia and Egypt. Monthly mean temperature 2010-2040: November (based on the averaged output of 7 GCM models under Greenhouse Gas Emission Scenario A1b)
International Center for Agricultural Research in the Dry Areas (ICARDA)
2010
climate change, downscaling, GCM, temperature, emission scenario A1b
West Asia, Egypt, Israel, Jordan, Lebanon, Occupied Palestinian Territories, Syria
22.000000
46.000000
40.000000
18.000000
D_WGS_1984
WGS_1984
6378137.000000
298.257224

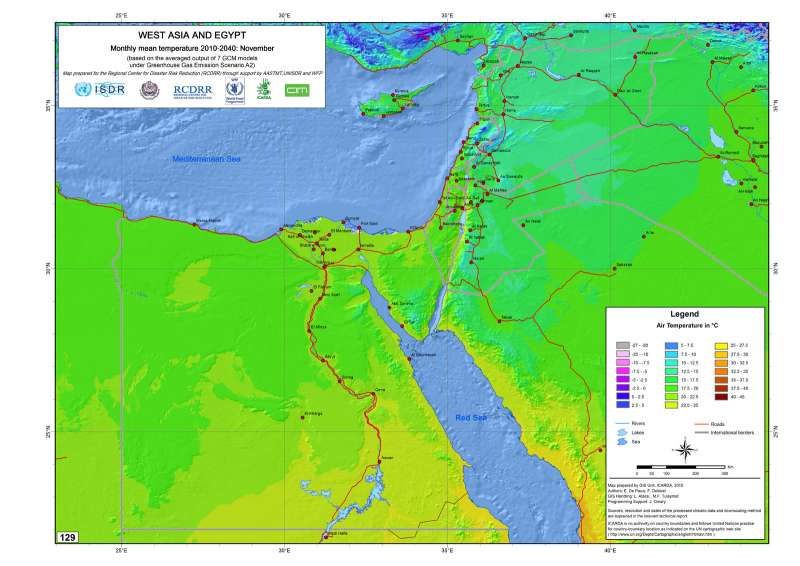
West Asia and Egypt. Monthly mean temperature 2010-2040: November
West Asia and Egypt. Monthly mean temperature 2010-2040: November (based on the averaged output of 7 GCM models under Greenhouse Gas Emission Scenario A2)
Metadataclose[x]
West Asia and Egypt. Monthly mean temperature 2010-2040: November
Baseline data to assist development agencies in planning for adaptation strategies to climate change
West Asia and Egypt. Monthly mean temperature 2010-2040: November (based on the averaged output of 7 GCM models under Greenhouse Gas Emission Scenario A2)
International Center for Agricultural Research in the Dry Areas (ICARDA)
2010
climate change, downscaling, GCM, temperature, emission scenario A2
West Asia, Egypt, Israel, Jordan, Lebanon, Occupied Palestinian Territories, Syria
22.000000
46.000000
40.000000
18.000000
D_WGS_1984
WGS_1984
6378137.000000
298.257224

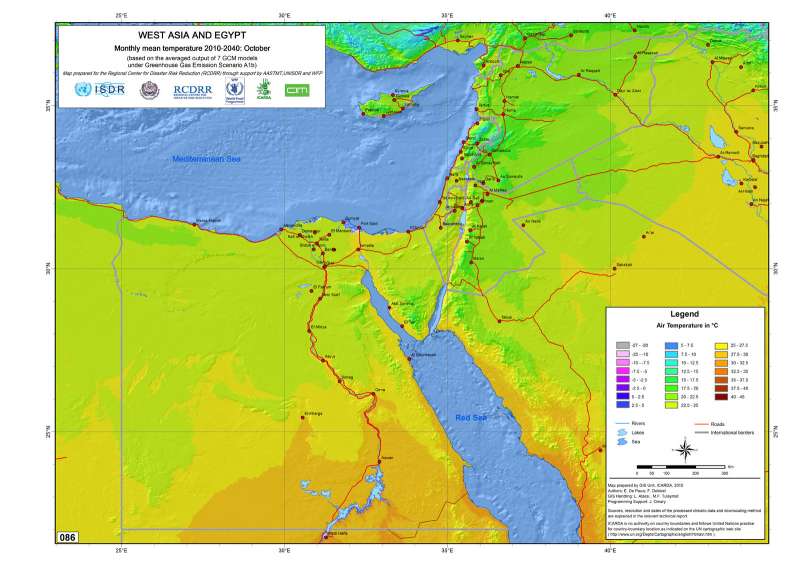
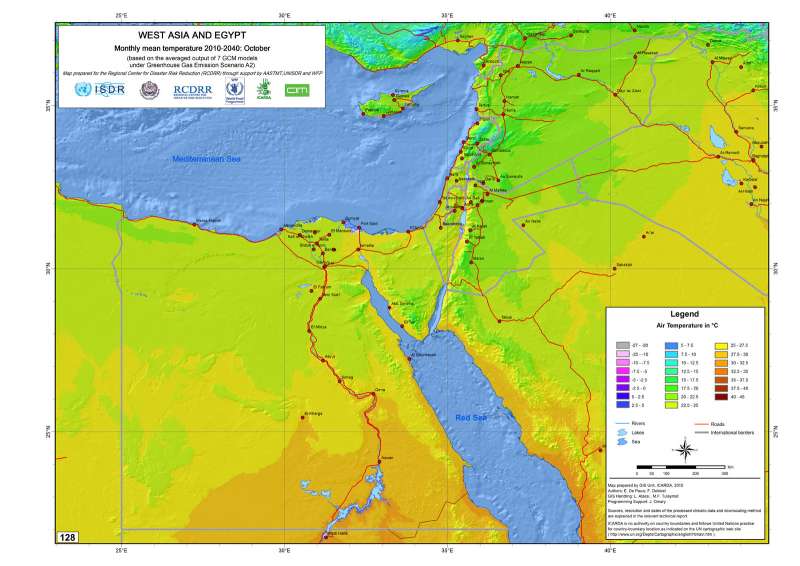
West Asia and Egypt. Monthly mean temperature 2010-2040: October
West Asia and Egypt. Monthly mean temperature 2010-2040: October (based on the averaged output of 7 GCM models under Greenhouse Gas Emission Scenario A1b)
Metadataclose[x]
West Asia and Egypt. Monthly mean temperature 2010-2040: October
Baseline data to assist development agencies in planning for adaptation strategies to climate change
West Asia and Egypt. Monthly mean temperature 2010-2040: October (based on the averaged output of 7 GCM models under Greenhouse Gas Emission Scenario A1b)
International Center for Agricultural Research in the Dry Areas (ICARDA)
2010
climate change, downscaling, GCM, temperature, emission scenario A1b
West Asia, Egypt, Israel, Jordan, Lebanon, Occupied Palestinian Territories, Syria
22.000000
46.000000
40.000000
18.000000
D_WGS_1984
WGS_1984
6378137.000000
298.257224

West Asia and Egypt. Monthly mean temperature 2010-2040: October
West Asia and Egypt. Monthly mean temperature 2010-2040: October (based on the averaged output of 7 GCM models under Greenhouse Gas Emission Scenario A2)
Metadataclose[x]
West Asia and Egypt. Monthly mean temperature 2010-2040: October
Baseline data to assist development agencies in planning for adaptation strategies to climate change
West Asia and Egypt. Monthly mean temperature 2010-2040: October (based on the averaged output of 7 GCM models under Greenhouse Gas Emission Scenario A2)
International Center for Agricultural Research in the Dry Areas (ICARDA)
2010
climate change, downscaling, GCM, temperature, emission scenario A2
West Asia, Egypt, Israel, Jordan, Lebanon, Occupied Palestinian Territories, Syria
22.000000
46.000000
40.000000
18.000000
D_WGS_1984
WGS_1984
6378137.000000
298.257224

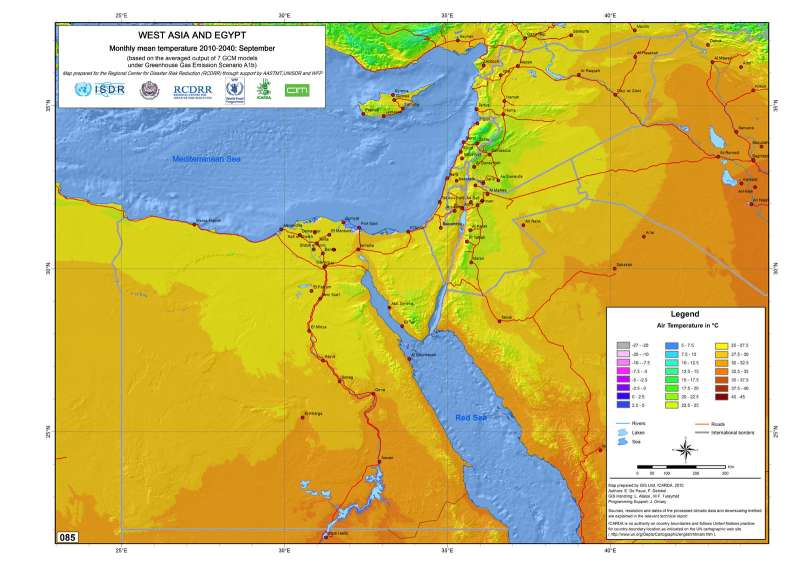
West Asia and Egypt. Monthly mean temperature 2010-2040: September
West Asia and Egypt. Monthly mean temperature 2010-2040:September (based on the averaged output of 7 GCM models under Greenhouse Gas Emission Scenario A1b)
Metadataclose[x]
West Asia and Egypt. Monthly mean temperature 2010-2040: September
Baseline data to assist development agencies in planning for adaptation strategies to climate change
West Asia and Egypt. Monthly mean temperature 2010-2040:September (based on the averaged output of 7 GCM models under Greenhouse Gas Emission Scenario A1b)
International Center for Agricultural Research in the Dry Areas (ICARDA)
2010
climate change, downscaling, GCM, temperature, emission scenario A1b
West Asia, Egypt, Israel, Jordan, Lebanon, Occupied Palestinian Territories, Syria
22.000000
46.000000
40.000000
18.000000
D_WGS_1984
WGS_1984
6378137.000000
298.257224

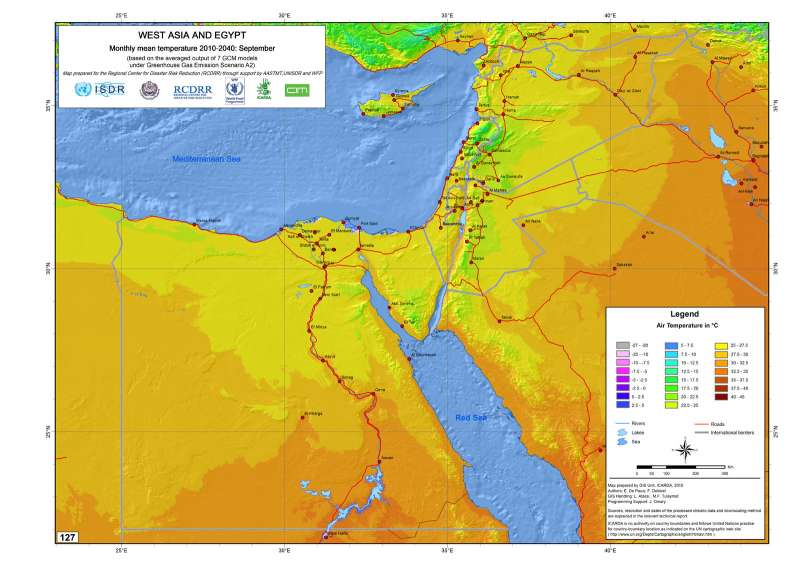
West Asia and Egypt. Monthly mean temperature 2010-2040: September
West Asia and Egypt. Monthly mean temperature 2010-2040: September (based on the averaged output of 7 GCM models under Greenhouse Gas Emission Scenario A2)
Metadataclose[x]
West Asia and Egypt. Monthly mean temperature 2010-2040: September
Baseline data to assist development agencies in planning for adaptation strategies to climate change
West Asia and Egypt. Monthly mean temperature 2010-2040: September (based on the averaged output of 7 GCM models under Greenhouse Gas Emission Scenario A2)
International Center for Agricultural Research in the Dry Areas (ICARDA)
2010
climate change, downscaling, GCM, temperature, emission scenario A2
West Asia, Egypt, Israel, Jordan, Lebanon, Occupied Palestinian Territories, Syria
22.000000
46.000000
40.000000
18.000000
D_WGS_1984
WGS_1984
6378137.000000
298.257224

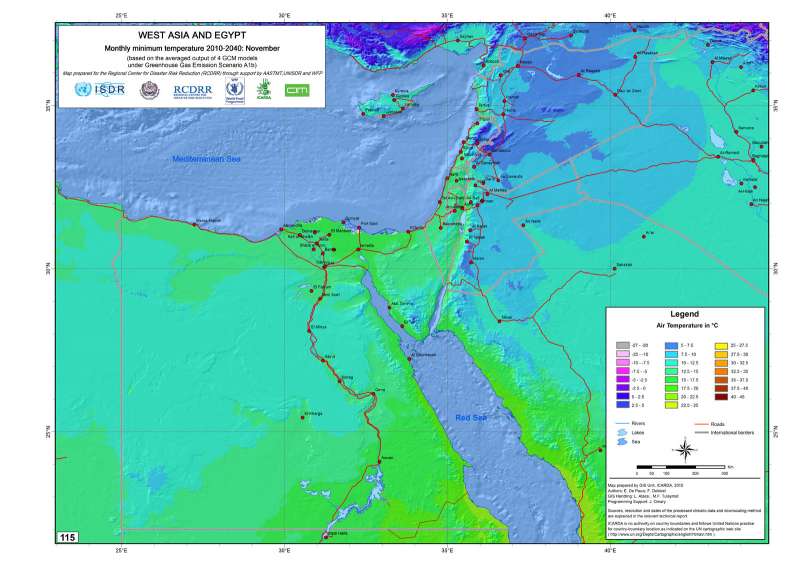
West Asia and Egypt. Monthly minimum temperature 2010-2040:
West Asia and Egypt. Monthly minimum temperature 2010-2040: November (based on the averaged output of 7 GCM models under Greenhouse Gas Emission Scenario A1b)
Metadataclose[x]
West Asia and Egypt. Monthly minimum temperature 2010-2040:
Baseline data to assist development agencies in planning for adaptation strategies to climate change
West Asia and Egypt. Monthly minimum temperature 2010-2040: November (based on the averaged output of 7 GCM models under Greenhouse Gas Emission Scenario A1b)
International Center for Agricultural Research in the Dry Areas (ICARDA)
2010
climate change, downscaling, GCM, temperature, emission scenario A1b
West Asia, Egypt, Israel, Jordan, Lebanon, Occupied Palestinian Territories, Syria
22.000000
46.000000
40.000000
18.000000
D_WGS_1984
WGS_1984
6378137.000000
298.257224

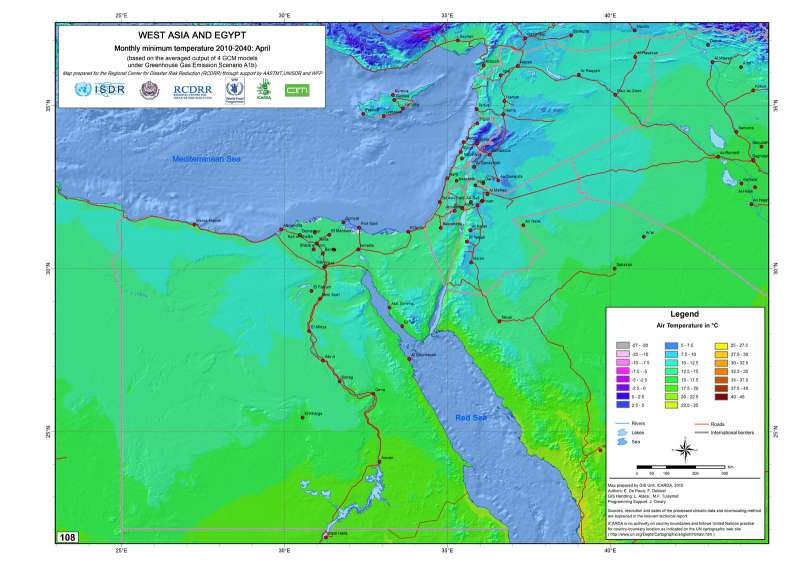
West Asia and Egypt. Monthly minimum temperature 2010-2040: April
West Asia and Egypt. Monthly minimum temperature 2010-2040: April (based on the averaged output of 7 GCM models under Greenhouse Gas Emission Scenario A1b)
Metadataclose[x]
West Asia and Egypt. Monthly minimum temperature 2010-2040: April
Baseline data to assist development agencies in planning for adaptation strategies to climate change
West Asia and Egypt. Monthly minimum temperature 2010-2040: April (based on the averaged output of 7 GCM models under Greenhouse Gas Emission Scenario A1b)
International Center for Agricultural Research in the Dry Areas (ICARDA)
2010
climate change, downscaling, GCM, temperature, emission scenario A1b
West Asia, Egypt, Israel, Jordan, Lebanon, Occupied Palestinian Territories, Syria
22.000000
46.000000
40.000000
18.000000
D_WGS_1984
WGS_1984
6378137.000000
298.257224

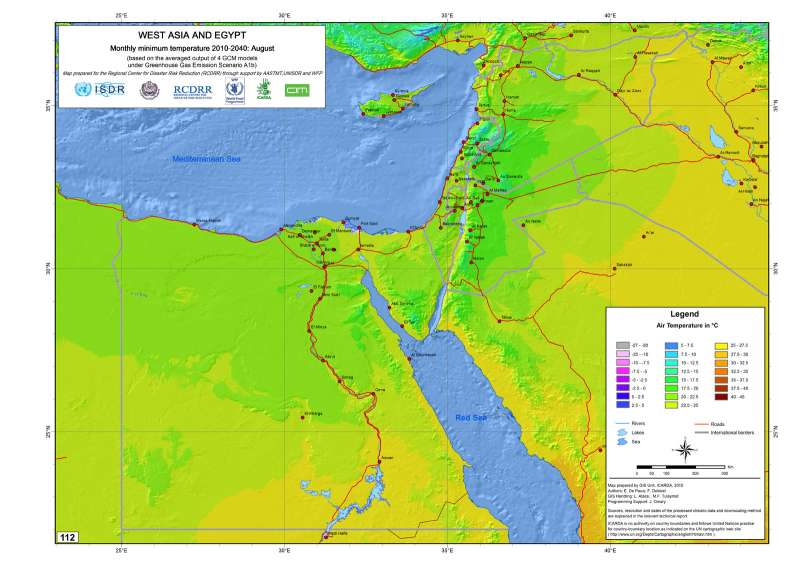
West Asia and Egypt. Monthly minimum temperature 2010-2040: August
West Asia and Egypt. Monthly minimum temperature 2010-2040: August (based on the averaged output of 7 GCM models under Greenhouse Gas Emission Scenario A1b)
Metadataclose[x]
West Asia and Egypt. Monthly minimum temperature 2010-2040: August
Baseline data to assist development agencies in planning for adaptation strategies to climate change
West Asia and Egypt. Monthly minimum temperature 2010-2040: August (based on the averaged output of 7 GCM models under Greenhouse Gas Emission Scenario A1b)
International Center for Agricultural Research in the Dry Areas (ICARDA)
2010
climate change., downscaling, GCM, temperature, emission scenario A1b
West Asia, Egypt, Israel, Jordan, Lebanon, Occupied Palestinian Territories, Syria
22.000000
46.000000
40.000000
18.000000
D_WGS_1984
WGS_1984
6378137.000000
298.257224

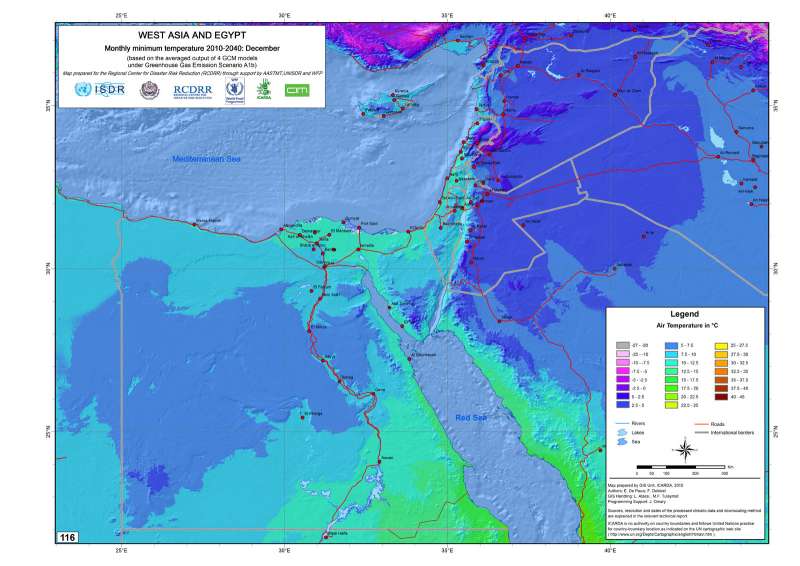
West Asia and Egypt. Monthly minimum temperature 2010-2040: December
West Asia and Egypt. Monthly minimum temperature 2010-2040: December (based on the averaged output of 7 GCM models under Greenhouse Gas Emission Scenario A1b)
Metadataclose[x]
West Asia and Egypt. Monthly minimum temperature 2010-2040: December
Baseline data to assist development agencies in planning for adaptation strategies to climate change
West Asia and Egypt. Monthly minimum temperature 2010-2040: December (based on the averaged output of 7 GCM models under Greenhouse Gas Emission Scenario A1b)
International Center for Agricultural Research in the Dry Areas (ICARDA)
2010
climate change, downscaling, GCM, temperature, emission scenario A1b
West Asia, Egypt, Israel, Jordan, Lebanon, Occupied Palestinian Territories, Syria
22.000000
46.000000
40.000000
18.000000
D_WGS_1984
WGS_1984
6378137.000000
298.257224

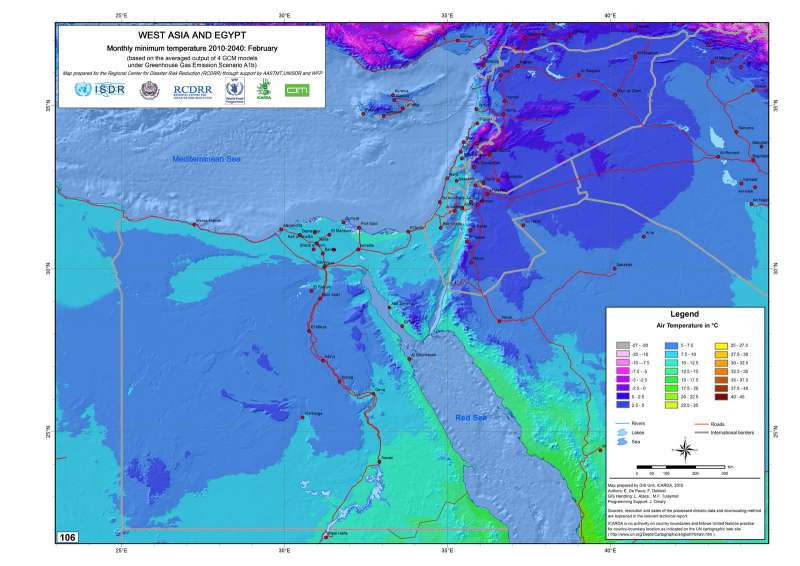
West Asia and Egypt. Monthly minimum temperature 2010-2040: February
West Asia and Egypt. Monthly minimum temperature 2010-2040: February (based on the averaged output of 7 GCM models under Greenhouse Gas Emission Scenario A1b)
Metadataclose[x]
West Asia and Egypt. Monthly minimum temperature 2010-2040: February
Baseline data to assist development agencies in planning for adaptation strategies to climate change
West Asia and Egypt. Monthly minimum temperature 2010-2040: February (based on the averaged output of 7 GCM models under Greenhouse Gas Emission Scenario A1b)
International Center for Agricultural Research in the Dry Areas (ICARDA)
2010
climate change, downscaling, GCM, temperature, emission scenario A1b
West Asia, Egypt, Israel, Jordan, Lebanon, Occupied Palestinian Territories, Syria
22.000000
46.000000
40.000000
18.000000
D_WGS_1984
WGS_1984
6378137.000000
298.257224

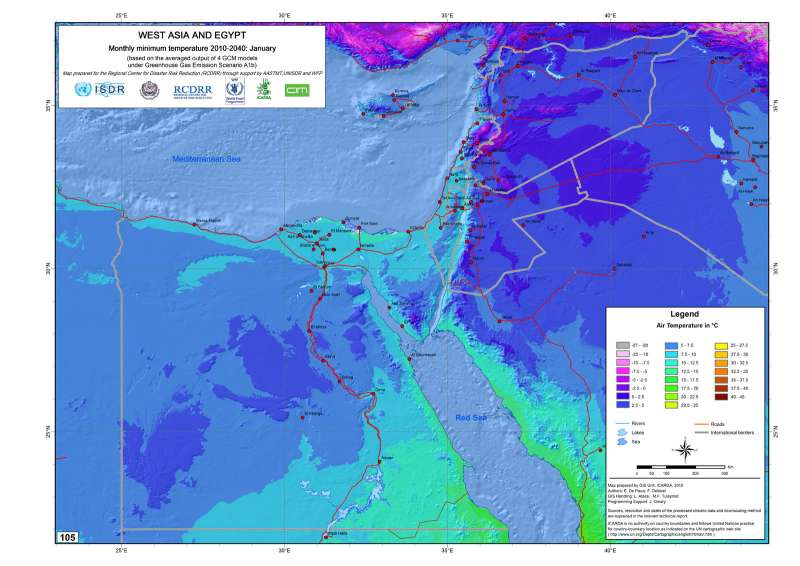
West Asia and Egypt. Monthly minimum temperature 2010-2040: January
West Asia and Egypt. Monthly minimum temperature 2010-2040: January (based on the averaged output of 7 GCM models under Greenhouse Gas Emission Scenario A1b)
Metadataclose[x]
West Asia and Egypt. Monthly minimum temperature 2010-2040: January
Baseline data to assist development agencies in planning for adaptation strategies to climate change
West Asia and Egypt. Monthly minimum temperature 2010-2040: January (based on the averaged output of 7 GCM models under Greenhouse Gas Emission Scenario A1b)
International Center for Agricultural Research in the Dry Areas (ICARDA)
2010
climate change, downscaling, GCM, temperature, emission scenario A1b
West Asia, Egypt, Israel, Jordan, Lebanon, Occupied Palestinian Territories, Syria
22.000000
46.000000
40.000000
18.000000
D_WGS_1984
WGS_1984
6378137.000000
298.257224

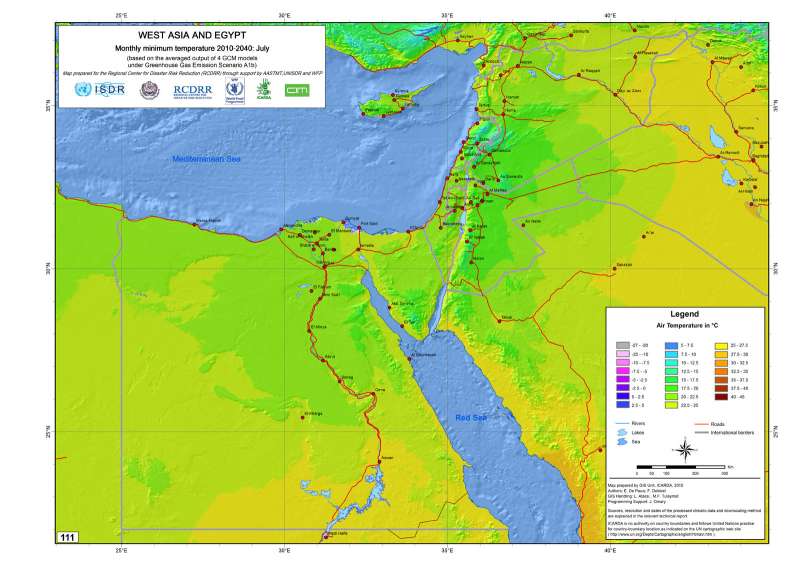
West Asia and Egypt. Monthly minimum temperature 2010-2040: July
West Asia and Egypt. Monthly minimum temperature 2010-2040: July (based on the averaged output of 7 GCM models under Greenhouse Gas Emission Scenario A1b)
Metadataclose[x]
West Asia and Egypt. Monthly minimum temperature 2010-2040: July
Baseline data to assist development agencies in planning for adaptation strategies to climate change
West Asia and Egypt. Monthly minimum temperature 2010-2040: July (based on the averaged output of 7 GCM models under Greenhouse Gas Emission Scenario A1b)
International Center for Agricultural Research in the Dry Areas (ICARDA)
2010
climate change, downscaling, GCM, temperature, emission scenario A1b
West Asia, Egypt, Israel, Jordan, Lebanon, Occupied Palestinian Territories, Syria
22.000000
46.000000
40.000000
18.000000
D_WGS_1984
WGS_1984
6378137.000000
298.257224

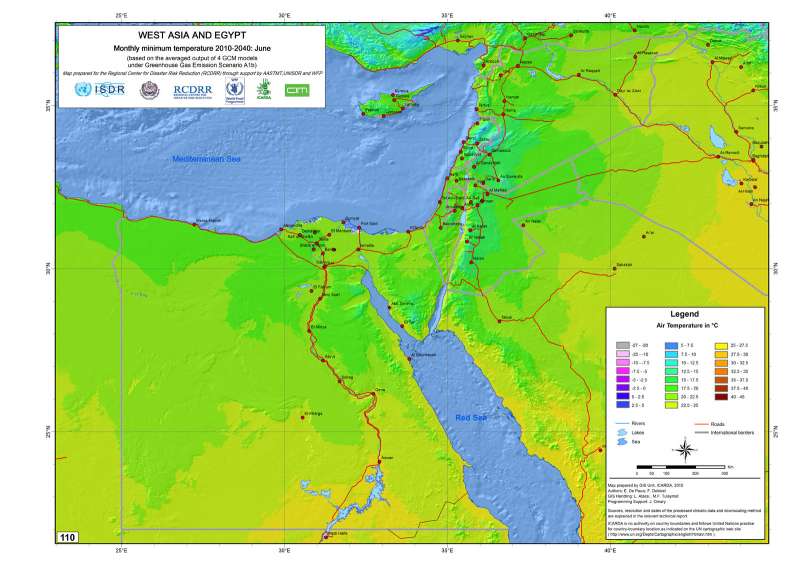
West Asia and Egypt. Monthly minimum temperature 2010-2040: June
West Asia and Egypt. Monthly minimum temperature 2010-2040: June (based on the averaged output of 7 GCM models under Greenhouse Gas Emission Scenario A1b)
Metadataclose[x]
West Asia and Egypt. Monthly minimum temperature 2010-2040: June
Baseline data to assist development agencies in planning for adaptation strategies to climate change
West Asia and Egypt. Monthly minimum temperature 2010-2040: June (based on the averaged output of 7 GCM models under Greenhouse Gas Emission Scenario A1b)
International Center for Agricultural Research in the Dry Areas (ICARDA)
2010
climate change, downscaling, GCM, temperature, emission scenario A1b
West Asia, Egypt, Israel, Jordan, Lebanon, Occupied Palestinian Territories, Syria
22.000000
46.000000
40.000000
18.000000
D_WGS_1984
WGS_1984
6378137.000000
298.257224

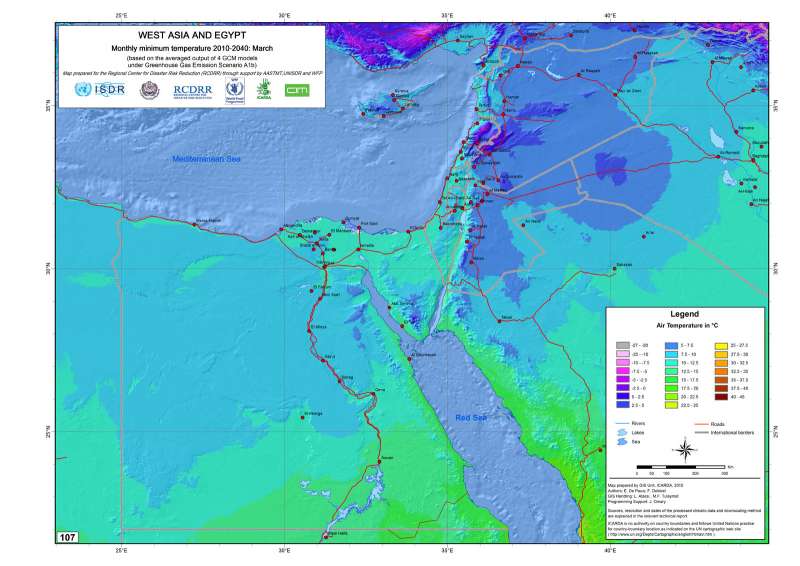
West Asia and Egypt. Monthly minimum temperature 2010-2040: March
West Asia and Egypt. Monthly minimum temperature 2010-2040: March (based on the averaged output of 7 GCM models under Greenhouse Gas Emission Scenario A1b)
Metadataclose[x]
West Asia and Egypt. Monthly minimum temperature 2010-2040: March
Baseline data to assist development agencies in planning for adaptation strategies to climate change
West Asia and Egypt. Monthly minimum temperature 2010-2040: March (based on the averaged output of 7 GCM models under Greenhouse Gas Emission Scenario A1b)
International Center for Agricultural Research in the Dry Areas (ICARDA)
2010
climate change, downscaling, GCM, temperature, emission scenario A1b
West Asia, Egypt, Israel, Jordan, Lebanon, Occupied Palestinian Territories, Syria
22.000000
46.000000
40.000000
18.000000
D_WGS_1984
WGS_1984
6378137.000000
298.257224

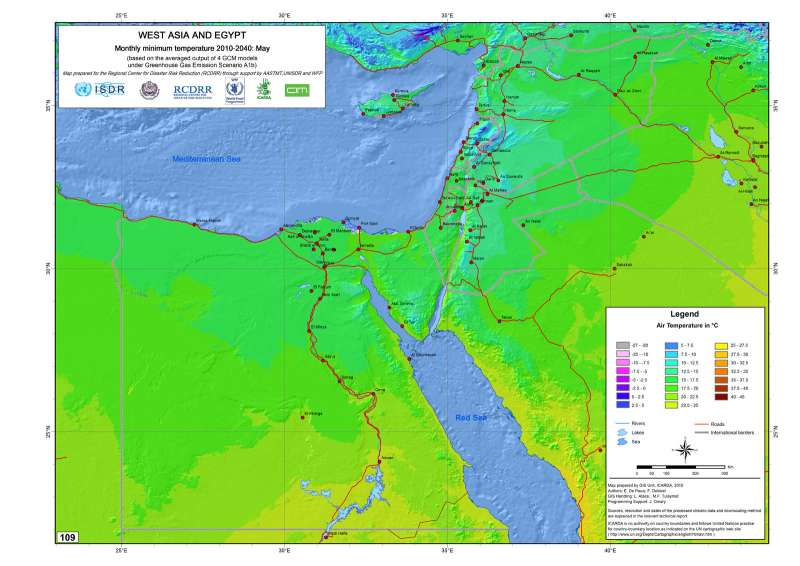
West Asia and Egypt. Monthly minimum temperature 2010-2040: May
West Asia and Egypt. Monthly minimum temperature 2010-2040: May (based on the averaged output of 7 GCM models under Greenhouse Gas Emission Scenario A1b)
Metadataclose[x]
West Asia and Egypt. Monthly minimum temperature 2010-2040: May
Baseline data to assist development agencies in planning for adaptation strategies to climate change
West Asia and Egypt. Monthly minimum temperature 2010-2040: May (based on the averaged output of 7 GCM models under Greenhouse Gas Emission Scenario A1b)
International Center for Agricultural Research in the Dry Areas (ICARDA)
2010
climate change, downscaling, GCM, temperature, emission scenario A1b
West Asia, Egypt, Israel, Jordan, Lebanon, Occupied Palestinian Territories, Syria
22.000000
46.000000
40.000000
18.000000
D_WGS_1984
WGS_1984
6378137.000000
298.257224

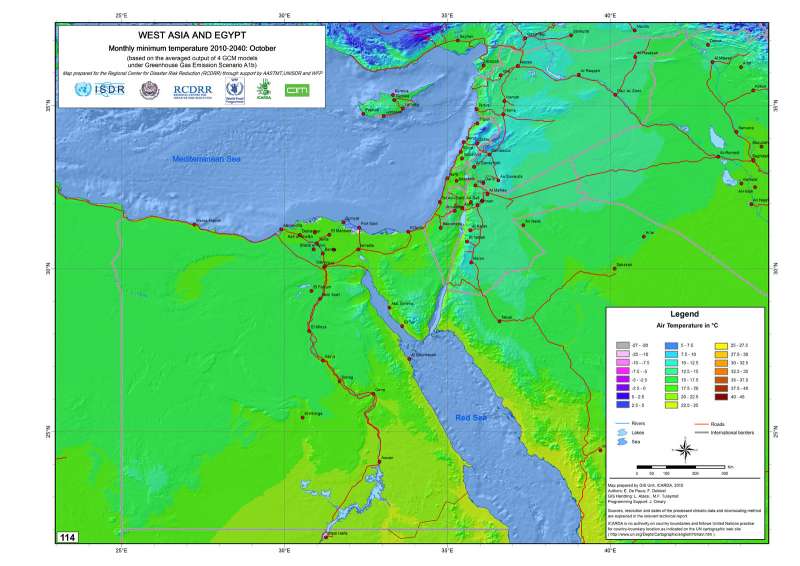
West Asia and Egypt. Monthly minimum temperature 2010-2040: October
West Asia and Egypt. Monthly minimum temperature 2010-2040: October (based on the averaged output of 7 GCM models under Greenhouse Gas Emission Scenario A1b)
Metadataclose[x]
West Asia and Egypt. Monthly minimum temperature 2010-2040: October
Baseline data to assist development agencies in planning for adaptation strategies to climate change
West Asia and Egypt. Monthly minimum temperature 2010-2040: October (based on the averaged output of 7 GCM models under Greenhouse Gas Emission Scenario A1b)
International Center for Agricultural Research in the Dry Areas (ICARDA)
2010
climate change, downscaling, GCM, temperature, emission scenario A1b
West Asia, Egypt, Israel, Jordan, Lebanon, Occupied Palestinian Territories, Syria
22.000000
46.000000
40.000000
18.000000
D_WGS_1984
WGS_1984
6378137.000000
298.257224

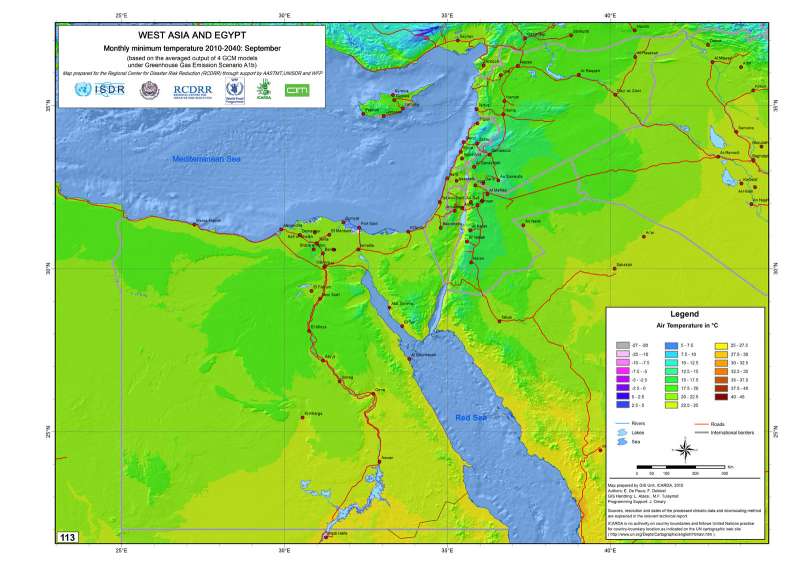
West Asia and Egypt. Monthly minimum temperature 2010-2040: September
West Asia and Egypt. Monthly minimum temperature 2010-2040: September (based on the averaged output of 7 GCM models under Greenhouse Gas Emission Scenario A1b)
Metadataclose[x]
West Asia and Egypt. Monthly minimum temperature 2010-2040: September
Baseline data to assist development agencies in planning for adaptation strategies to climate change
West Asia and Egypt. Monthly minimum temperature 2010-2040: September (based on the averaged output of 7 GCM models under Greenhouse Gas Emission Scenario A1b)
International Center for Agricultural Research in the Dry Areas (ICARDA)
2010
climate change, downscaling, GCM, temperature, emission scenario A1b
West Asia, Egypt, Israel, Jordan, Lebanon, Occupied Palestinian Territories, Syria
22.000000
46.000000
40.000000
18.000000
D_WGS_1984
WGS_1984
6378137.000000
298.257224

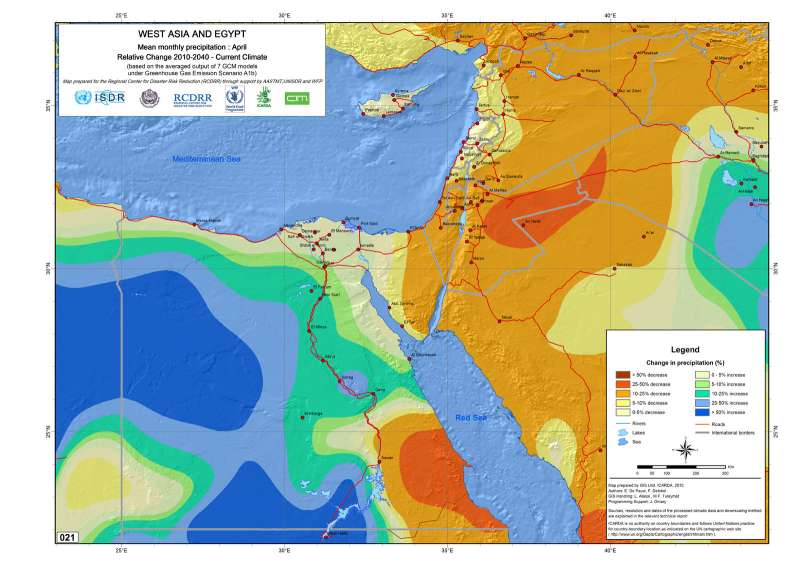
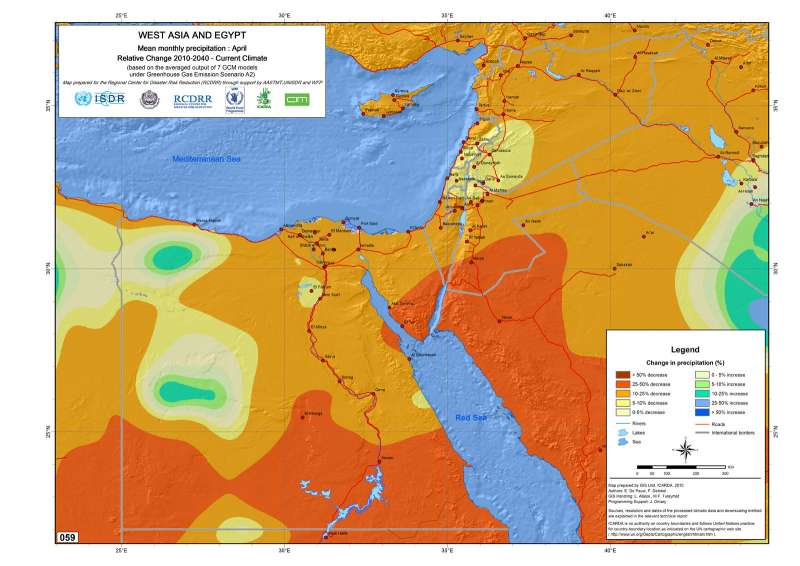
West Asia and Egypt. Relative precipitation change 2010-2040/current climate: April
West Asia and Egypt. Relative precipitation change 2010-2040/current climate: April (based on the averaged output of 7 GCM models under Greenhouse Gas Emission Scenario A1b)
Metadataclose[x]
West Asia and Egypt. Relative precipitation change 2010-2040/current climate: April
Baseline data to assist development agencies in planning for adaptation strategies to climate change
West Asia and Egypt. Relative precipitation change 2010-2040/current climate: April (based on the averaged output of 7 GCM models under Greenhouse Gas Emission Scenario A1b)
International Center for Agricultural Research in the Dry Areas (ICARDA)
2010
climate change, downscaling, GCM, precipitation, emission scenario A1b
West Asia, Egypt, Israel, Jordan, Lebanon, Occupied Palestinian Territories, Syria
15.329752
46.013085
44.627669
16.736002
D_WGS_1984
WGS_1984
6378137.000000
298.257224

West Asia and Egypt. Relative precipitation change 2010-2040/current climate: April
West Asia and Egypt. Relative precipitation change 2010-2040/current climate: April (based on the averaged output of 7 GCM models under Greenhouse Gas Emission Scenario A2)
Metadataclose[x]
West Asia and Egypt. Relative precipitation change 2010-2040/current climate: April
Baseline data to assist development agencies in planning for adaptation strategies to climate change
West Asia and Egypt. Relative precipitation change 2010-2040/current climate: April (based on the averaged output of 7 GCM models under Greenhouse Gas Emission Scenario A2)
International Center for Agricultural Research in the Dry Areas (ICARDA)
2010
climate change, downscaling, GCM, precipitation
West Asia, Egypt, Israel, Jordan, Lebanon, Occupied Palestinian Territories, Syria
15.329752
46.013085
44.627669
16.736002
D_WGS_1984
WGS_1984
6378137.000000
298.257224

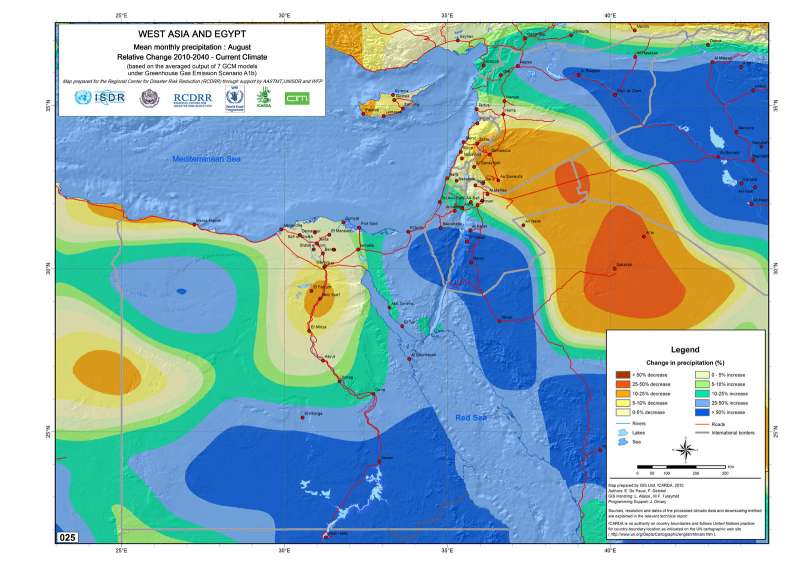
West Asia and Egypt. Relative precipitation change 2010-2040/current climate: August
West Asia and Egypt. Relative precipitation change 2010-2040/current climate: August (based on the averaged output of 7 GCM models under Greenhouse Gas Emission Scenario A1b)
Metadataclose[x]
West Asia and Egypt. Relative precipitation change 2010-2040/current climate: August
Baseline data to assist development agencies in planning for adaptation strategies to climate change
West Asia and Egypt. Relative precipitation change 2010-2040/current climate: August (based on the averaged output of 7 GCM models under Greenhouse Gas Emission Scenario A1b)
International Center for Agricultural Research in the Dry Areas (ICARDA)
2010
climate change, downscaling, GCM, emission scenario A1b, precipitation
West Asia, Egypt, Israel, Jordan, Lebanon, Occupied Palestinian Territories, Syria
15.329752
46.013085
44.627669
16.736002
D_WGS_1984
WGS_1984
6378137.000000
298.257224

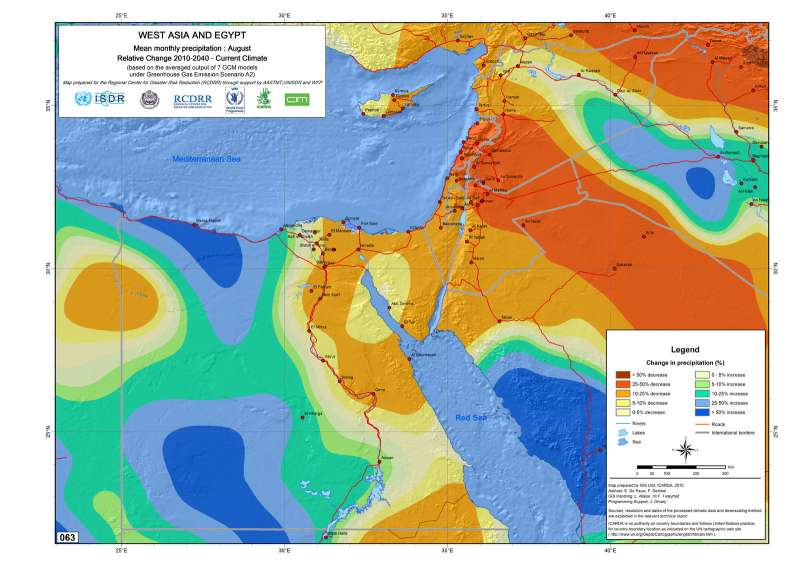
West Asia and Egypt. Relative precipitation change 2010-2040/current climate: August
West Asia and Egypt. Relative precipitation change 2010-2040/current climate: August (based on the averaged output of 7 GCM models under Greenhouse Gas Emission Scenario A2)
Metadataclose[x]
West Asia and Egypt. Relative precipitation change 2010-2040/current climate: August
Baseline data to assist development agencies in planning for adaptation strategies to climate change
West Asia and Egypt. Relative precipitation change 2010-2040/current climate: August (based on the averaged output of 7 GCM models under Greenhouse Gas Emission Scenario A2)
International Center for Agricultural Research in the Dry Areas (ICARDA)
2010
climate change, downscaling, GCM, precipitation, emission scenario A2
West Asia, Egypt, Israel, Jordan, Lebanon, Occupied Palestinian Territories, Syria
15.329752
46.013085
44.627669
16.736002
D_WGS_1984
WGS_1984
6378137.000000
298.257224

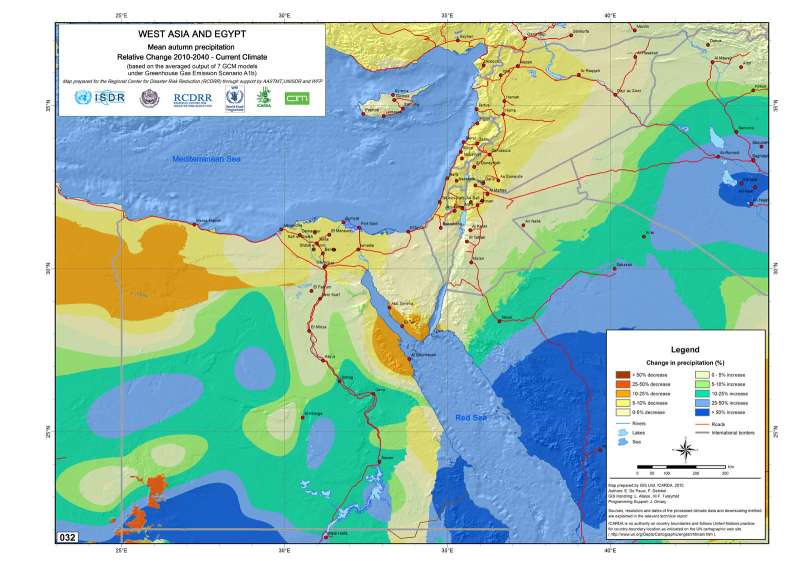
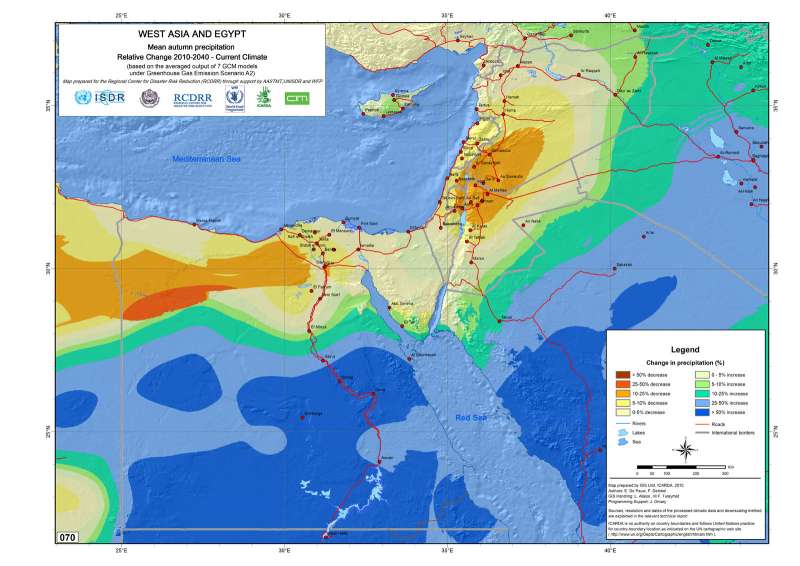
West Asia and Egypt. Relative precipitation change 2010-2040/current climate: Autumn
West Asia and Egypt. Relative precipitation change 2010-2040/current climate: Autumn (based on the averaged output of 7 GCM models under Greenhouse Gas Emission Scenario A1b)
Metadataclose[x]
West Asia and Egypt. Relative precipitation change 2010-2040/current climate: Autumn
Baseline data to assist development agencies in planning for adaptation strategies to climate change
West Asia and Egypt. Relative precipitation change 2010-2040/current climate: Autumn (based on the averaged output of 7 GCM models under Greenhouse Gas Emission Scenario A1b)
International Center for Agricultural Research in the Dry Areas (ICARDA)
2010
climate change, downscaling, GCM, precipitation, emission scenario A1b
West Asia, Egypt, Israel, Jordan, Lebanon, Occupied Palestinian Territories, Syria
15.329752
46.013085
44.627669
16.736002
D_WGS_1984
WGS_1984
6378137.000000
298.257224

West Asia and Egypt. Relative precipitation change 2010-2040/current climate: Autumn
West Asia and Egypt. Relative precipitation change 2010-2040/current climate: Autumn (based on the averaged output of 7 GCM models under Greenhouse Gas Emission Scenario A2)
Metadataclose[x]
West Asia and Egypt. Relative precipitation change 2010-2040/current climate: Autumn
Baseline data to assist development agencies in planning for adaptation strategies to climate change
West Asia and Egypt. Relative precipitation change 2010-2040/current climate: Autumn (based on the averaged output of 7 GCM models under Greenhouse Gas Emission Scenario A2)
International Center for Agricultural Research in the Dry Areas (ICARDA)
2010
climate change, downscaling, GCM, precipitation, emission scenario A2
West Asia, Egypt, Israel, Jordan, Lebanon, Occupied Palestinian Territories, Syria
15.329752
46.013085
44.627669
16.736002
D_WGS_1984
WGS_1984
6378137.000000
298.257224

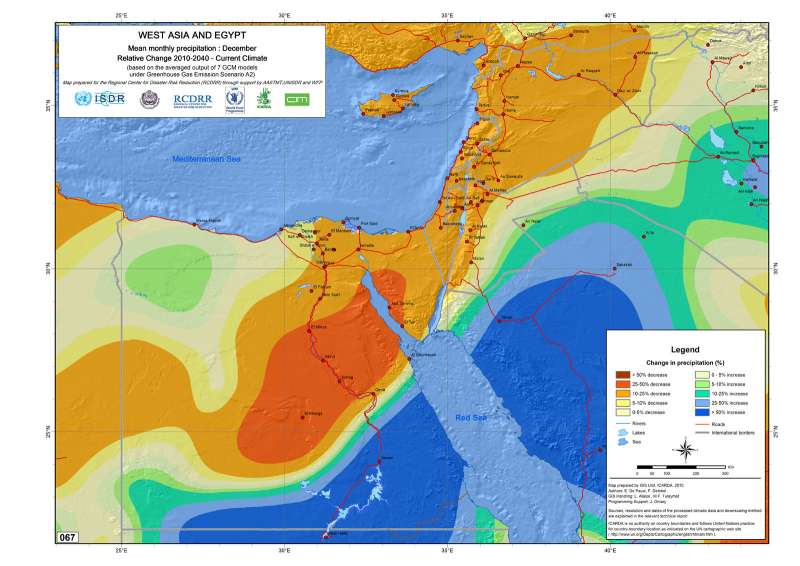
West Asia and Egypt. Relative precipitation change 2010-2040/current climate: December
West Asia and Egypt. Relative precipitation change 2010-2040/current climate: December (based on the averaged output of 7 GCM models under Greenhouse Gas Emission Scenario A1b)
Metadataclose[x]
West Asia and Egypt. Relative precipitation change 2010-2040/current climate: December
Baseline data to assist development agencies in planning for adaptation strategies to climate change
West Asia and Egypt. Relative precipitation change 2010-2040/current climate: December (based on the averaged output of 7 GCM models under Greenhouse Gas Emission Scenario A1b)
International Center for Agricultural Research in the Dry Areas (ICARDA)
2010
climate change, downscaling, precipitation, emission scenario A1b
West Asia, Egypt, Israel, Jordan, Lebanon, Occupied Palestinian Territories, Syria
15.329752
46.013085
44.627669
16.736002
D_WGS_1984
WGS_1984
6378137.000000
298.257224

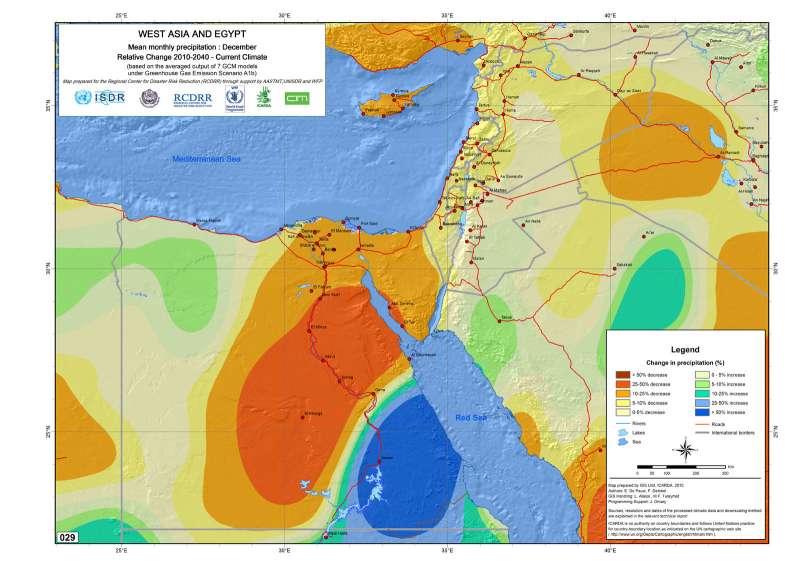
West Asia and Egypt. Relative precipitation change 2010-2040/current climate: December
West Asia and Egypt. Relative precipitation change 2010-2040/current climate: December (based on the averaged output of 7 GCM models under Greenhouse Gas Emission Scenario A2)
Metadataclose[x]
West Asia and Egypt. Relative precipitation change 2010-2040/current climate: December
Baseline data to assist development agencies in planning for adaptation strategies to climate change
West Asia and Egypt. Relative precipitation change 2010-2040/current climate: December (based on the averaged output of 7 GCM models under Greenhouse Gas Emission Scenario A2)
International Center for Agricultural Research in the Dry Areas (ICARDA)
2010
climate change, downscaling, GCM, precipitation, emission scenario A2
West Asia, Egypt, Israel, Israel, Jordan, Lebanon, Occupied Palestinian Territories, Syria
15.329752
46.013085
44.627669
16.736002
D_WGS_1984
WGS_1984
6378137.000000
298.257224

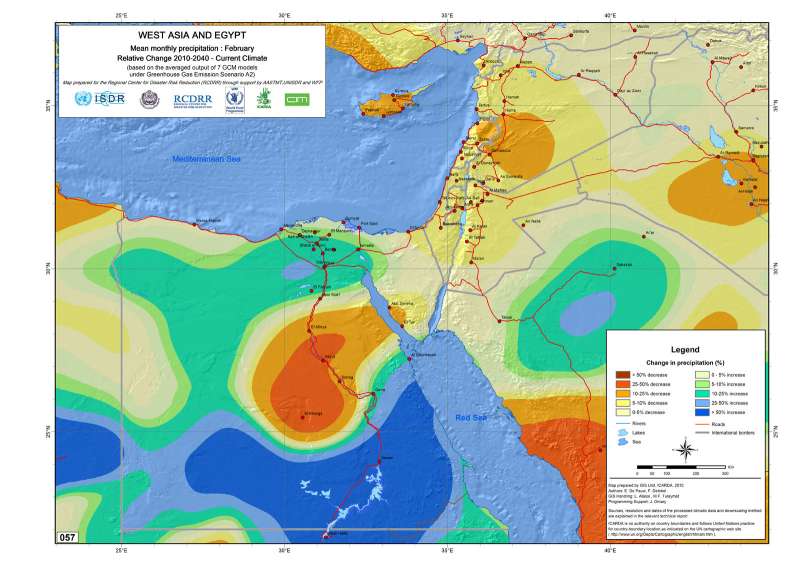
West Asia and Egypt. Relative precipitation change 2010-2040/current climate: February
West Asia and Egypt. Relative precipitation change 2010-2040/current climate: February (based on the averaged output of 7 GCM models under Greenhouse Gas Emission Scenario A1b)
Metadataclose[x]
West Asia and Egypt. Relative precipitation change 2010-2040/current climate: February
Baseline data to assist development agencies in planning for adaptation strategies to climate change
West Asia and Egypt. Relative precipitation change 2010-2040/current climate: February (based on the averaged output of 7 GCM models under Greenhouse Gas Emission Scenario A1b)
International Center for Agricultural Research in the Dry Areas (ICARDA)
2010
climate change, downscaling, GCM, precipitation, emission scenario A1b
West Asia, Egypt, Israel, Jordan, Lebanon, Occupied Palestinian Territories, Syria
15.329752
46.013085
44.627669
16.736002
D_WGS_1984
WGS_1984
6378137.000000
298.257224

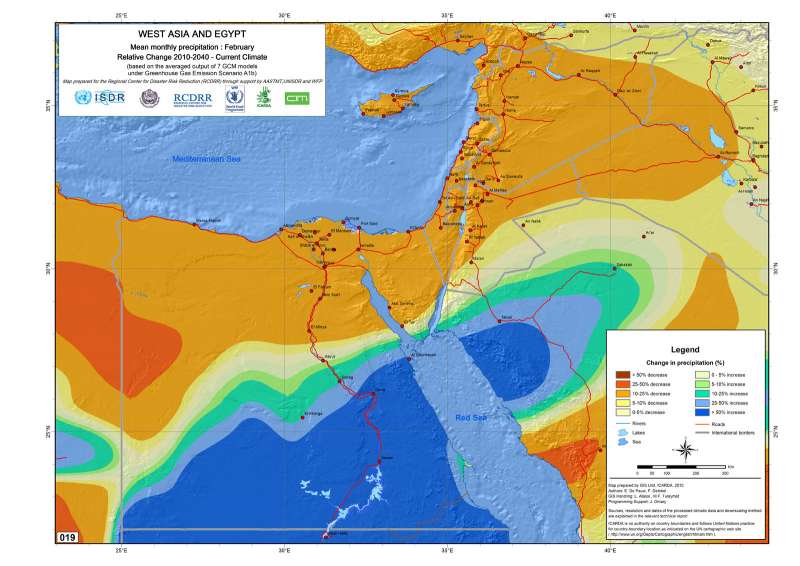
West Asia and Egypt. Relative precipitation change 2010-2040/current climate: February
West Asia and Egypt. Relative precipitation change 2010-2040/current climate: February (based on the averaged output of 7 GCM models under Greenhouse Gas Emission Scenario A2)
Metadataclose[x]
West Asia and Egypt. Relative precipitation change 2010-2040/current climate: February
Baseline data to assist development agencies in planning for adaptation strategies to climate change
West Asia and Egypt. Relative precipitation change 2010-2040/current climate: February (based on the averaged output of 7 GCM models under Greenhouse Gas Emission Scenario A2)
International Center for Agricultural Research in the Dry Areas (ICARDA)
2010
climate change, downscaling, GCM, precipitation, emission scenario A2
West Asia, Egypt, Israel, Jordan, Lebanon, Occupied Palestinian Territories, Syria
15.329752
46.013085
44.627669
16.736002
D_WGS_1984
WGS_1984
6378137.000000
298.257224

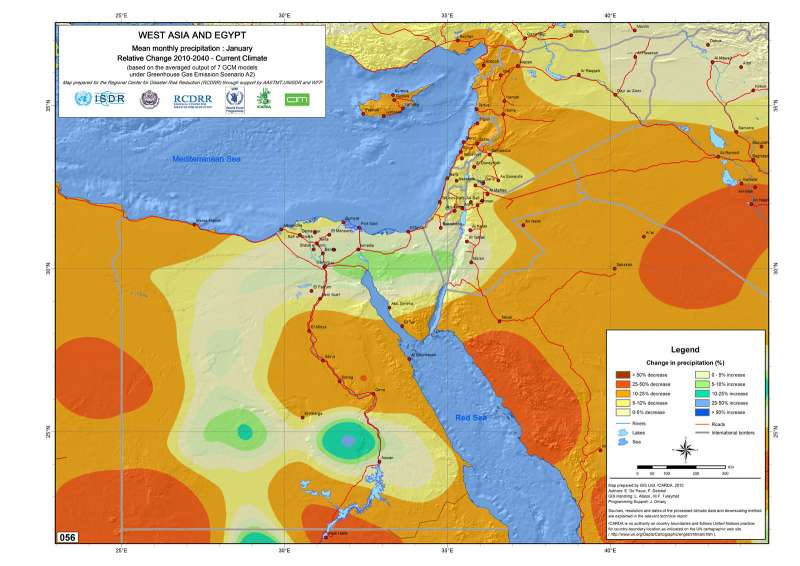
West Asia and Egypt. Relative precipitation change 2010-2040/current climate: January
West Asia and Egypt. Relative precipitation change 2010-2040/current climate: January (based on the averaged output of 7 GCM models under Greenhouse Gas Emission Scenario A2)
Metadataclose[x]
West Asia and Egypt. Relative precipitation change 2010-2040/current climate: January
Baseline data to assist development agencies in planning for adaptation strategies to climate change
West Asia and Egypt. Relative precipitation change 2010-2040/current climate: January (based on the averaged output of 7 GCM models under Greenhouse Gas Emission Scenario A2)
International Center for Agricultural Research in the Dry Areas (ICARDA)
2010
climate change, downscaling, GCM, precipitation, emission scenario A2
West Asia, Egypt, Israel, Jordan, Lebanon, Occupied Palestinian Territories, Syria
15.329752
46.013085
44.627669
16.736002
D_WGS_1984
WGS_1984
6378137.000000
298.257224

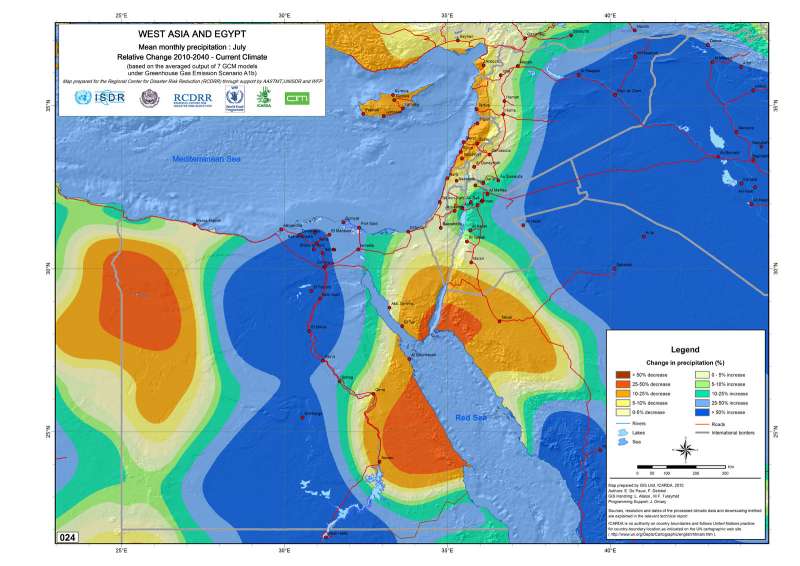
West Asia and Egypt. Relative precipitation change 2010-2040/current climate: July
West Asia and Egypt. Relative precipitation change 2010-2040/current climate: Jury (based on the averaged output of 7 GCM models under Greenhouse Gas Emission Scenario A1b)
Metadataclose[x]
West Asia and Egypt. Relative precipitation change 2010-2040/current climate: July
Baseline data to assist development agencies in planning for adaptation strategies to climate change
West Asia and Egypt. Relative precipitation change 2010-2040/current climate: Jury (based on the averaged output of 7 GCM models under Greenhouse Gas Emission Scenario A1b)
International Center for Agricultural Research in the Dry Areas (ICARDA)
2010
climate change, downscaling, GCM, emission scenario A1b, precipitation
West Asia, Egypt, Israel, Jordan, Lebanon, Occupied Palestinian Territories, Syria
15.329752
46.013085
44.627669
16.736002
D_WGS_1984
WGS_1984
6378137.000000
298.257224

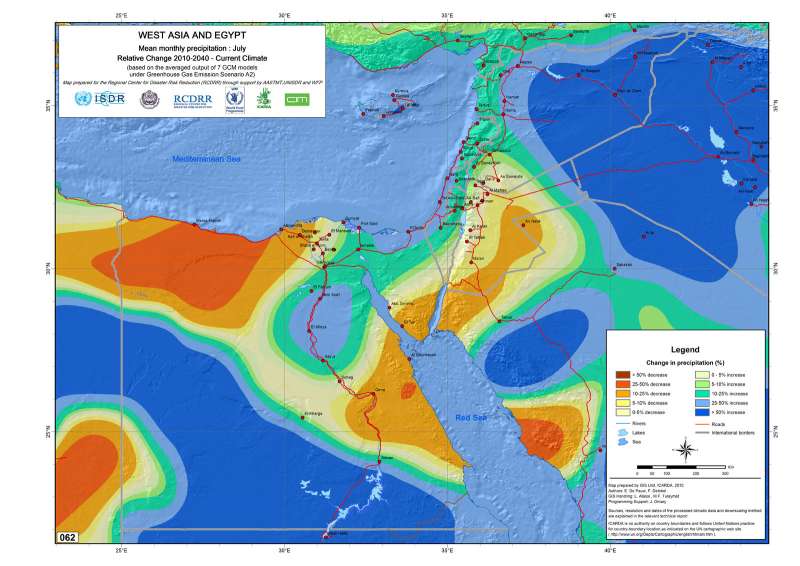
West Asia and Egypt. Relative precipitation change 2010-2040/current climate: July
West Asia and Egypt. Relative precipitation change 2010-2040/current climate: July (based on the averaged output of 7 GCM models under Greenhouse Gas Emission Scenario A2)
Metadataclose[x]
West Asia and Egypt. Relative precipitation change 2010-2040/current climate: July
Baseline data to assist development agencies in planning for adaptation strategies to climate change
West Asia and Egypt. Relative precipitation change 2010-2040/current climate: July (based on the averaged output of 7 GCM models under Greenhouse Gas Emission Scenario A2)
International Center for Agricultural Research in the Dry Areas (ICARDA)
2010
climate change, downscaling, GCM, precipitation, emission scenario A2
West Asia, Egypt, Israel, Jordan, Lebanon, Occupied Palestinian Territories, Syria
15.329752
46.013085
44.627669
16.736002
D_WGS_1984
WGS_1984
6378137.000000
298.257224

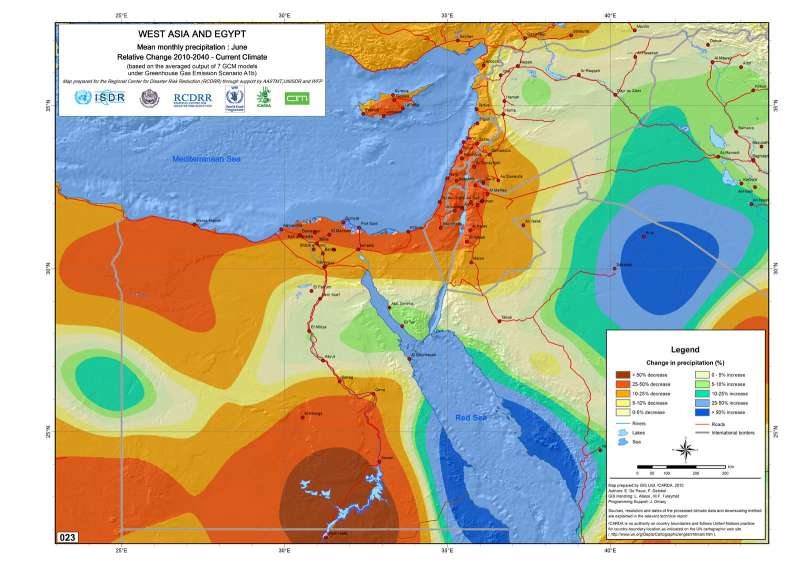
West Asia and Egypt. Relative precipitation change 2010-2040/current climate: June
West Asia and Egypt. Relative precipitation change 2010-2040/current climate: June (based on the averaged output of 7 GCM models under Greenhouse Gas Emission Scenario A1b)
Metadataclose[x]
West Asia and Egypt. Relative precipitation change 2010-2040/current climate: June
Baseline data to assist development agencies in planning for adaptation strategies to climate change
West Asia and Egypt. Relative precipitation change 2010-2040/current climate: June (based on the averaged output of 7 GCM models under Greenhouse Gas Emission Scenario A1b)
International Center for Agricultural Research in the Dry Areas (ICARDA)
2010
climate change, downscaling, GCM, precipitation, emission scenario A1b
West Asia, Egypt, Israel, Jordan, Lebanon, Occupied Palestinian Territories, Syria
15.329752
46.013085
44.627669
16.736002
D_WGS_1984
WGS_1984
6378137.000000
298.257224

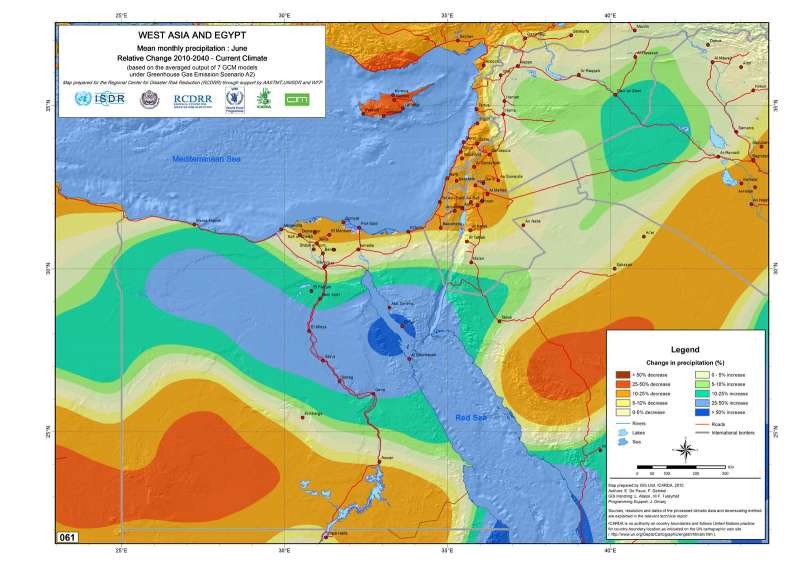
West Asia and Egypt. Relative precipitation change 2010-2040/current climate: June
West Asia and Egypt. Relative precipitation change 2010-2040/current climate: June (based on the averaged output of 7 GCM models under Greenhouse Gas Emission Scenario A2)
Metadataclose[x]
West Asia and Egypt. Relative precipitation change 2010-2040/current climate: June
Baseline data to assist development agencies in planning for adaptation strategies to climate change
West Asia and Egypt. Relative precipitation change 2010-2040/current climate: June (based on the averaged output of 7 GCM models under Greenhouse Gas Emission Scenario A2)
International Center for Agricultural Research in the Dry Areas (ICARDA)
2010
climate change, downscaling, GCM, precipitation, emission scenario A2
West Asia, Egypt, Israel, Jordan, Lebanon, Occupied Palestinian Territories, Syria
15.329752
46.013085
44.627669
16.736002
D_WGS_1984
WGS_1984
6378137.000000
298.257224

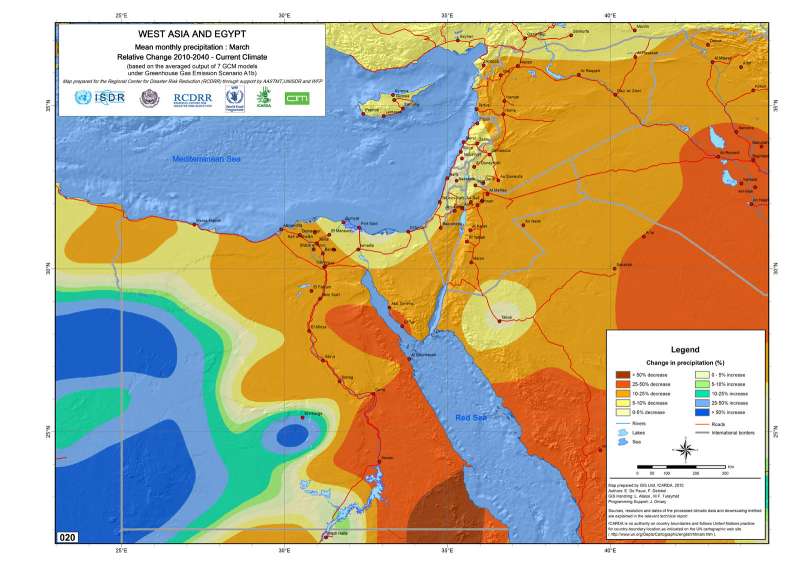
West Asia and Egypt. Relative precipitation change 2010-2040/current climate: March
West Asia and Egypt. Relative precipitation change 2010-2040/current climate: March (based on the averaged output of 7 GCM models under Greenhouse Gas Emission Scenario A1b)
Metadataclose[x]
West Asia and Egypt. Relative precipitation change 2010-2040/current climate: March
Baseline data to assist development agencies in planning for adaptation strategies to climate change
West Asia and Egypt. Relative precipitation change 2010-2040/current climate: March (based on the averaged output of 7 GCM models under Greenhouse Gas Emission Scenario A1b)
International Center for Agricultural Research in the Dry Areas (ICARDA)
2010
climate change, downscaling, GCM, precipitation, emission scenario A1b
West Asia, Egypt, Israel, Jordan, Lebanon, Occupied Palestinian Territories, Syria
15.329752
46.013085
44.627669
16.736002
D_WGS_1984
WGS_1984
6378137.000000
298.257224

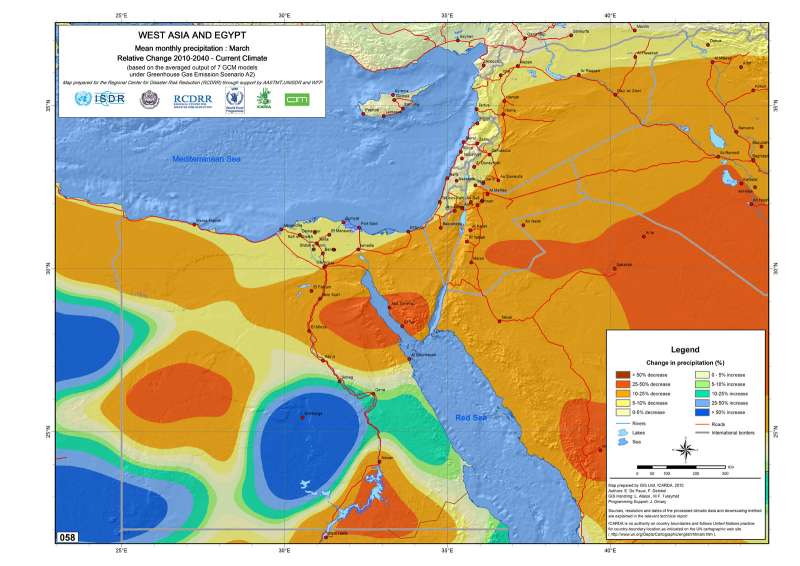
West Asia and Egypt. Relative precipitation change 2010-2040/current climate: March
West Asia and Egypt. Relative precipitation change 2010-2040/current climate: March (based on the averaged output of 7 GCM models under Greenhouse Gas Emission Scenario A2)
Metadataclose[x]
West Asia and Egypt. Relative precipitation change 2010-2040/current climate: March
Baseline data to assist development agencies in planning for adaptation strategies to climate change
West Asia and Egypt. Relative precipitation change 2010-2040/current climate: March (based on the averaged output of 7 GCM models under Greenhouse Gas Emission Scenario A2)
International Center for Agricultural Research in the Dry Areas (ICARDA)
2010
climate change, downscaling, GCM, precipitation, emission scenario A2
West Asia, Egypt, Israel, Jordan, Lebanon, Occupied Palestinian Territories, Syria
15.329752
46.013085
44.627669
16.736002
D_WGS_1984
WGS_1984
6378137.000000
298.257224

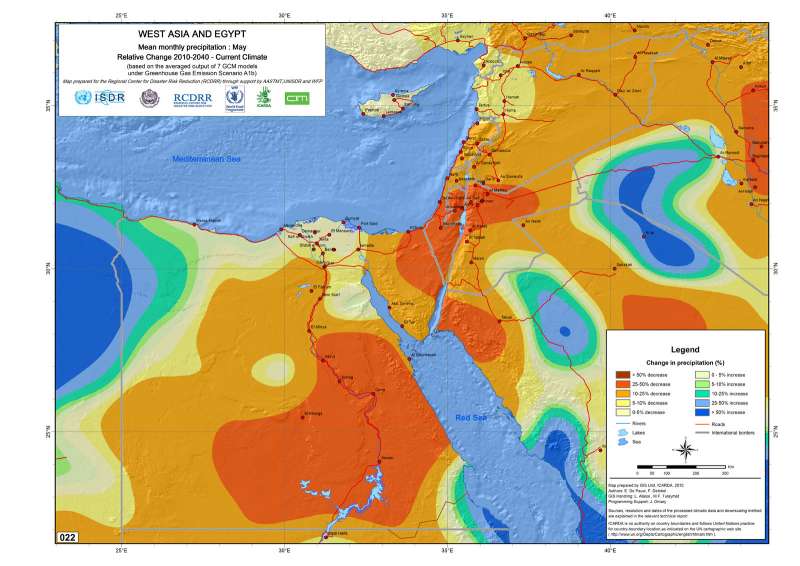
West Asia and Egypt. Relative precipitation change 2010-2040/current climate: May
West Asia and Egypt. Relative precipitation change 2010-2040/current climate: May (based on the averaged output of 7 GCM models under Greenhouse Gas Emission Scenario A1b)
Metadataclose[x]
West Asia and Egypt. Relative precipitation change 2010-2040/current climate: May
Baseline data to assist development agencies in planning for adaptation strategies to climate change
West Asia and Egypt. Relative precipitation change 2010-2040/current climate: May (based on the averaged output of 7 GCM models under Greenhouse Gas Emission Scenario A1b)
International Center for Agricultural Research in the Dry Areas (ICARDA)
2010
climate change, downscaling, GCM, precipitation, emission scenario A1b
West Asia, Egypt, Israel, Jordan, Lebanon, Occupied Palestinian Territories, Syria
15.329752
46.013085
44.627669
16.736002
D_WGS_1984
WGS_1984
6378137.000000
298.257224

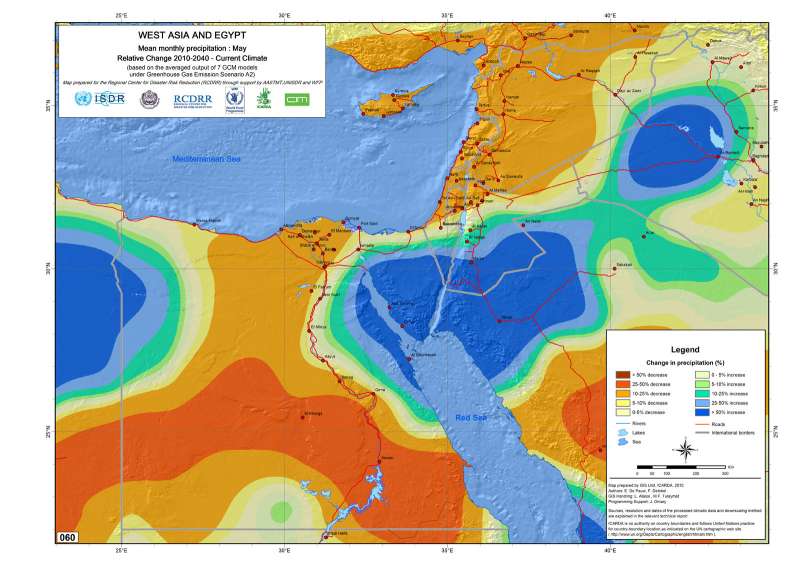
West Asia and Egypt. Relative precipitation change 2010-2040/current climate: May
West Asia and Egypt. Relative precipitation change 2010-2040/current climate: May (based on the averaged output of 7 GCM models under Greenhouse Gas Emission Scenario A2)
Metadataclose[x]
West Asia and Egypt. Relative precipitation change 2010-2040/current climate: May
Baseline data to assist development agencies in planning for adaptation strategies to climate change
West Asia and Egypt. Relative precipitation change 2010-2040/current climate: May (based on the averaged output of 7 GCM models under Greenhouse Gas Emission Scenario A2)
International Center for Agricultural Research in the Dry Areas (ICARDA)
2010
climate change, downscaling, GCM, precipitation, emission scenario A2
West Asia, Egypt, Israel, Jordan, Lebanon, Occupied Palestinian Territories, Syria
15.329752
46.013085
44.627669
16.736002
D_WGS_1984
WGS_1984
6378137.000000
298.257224

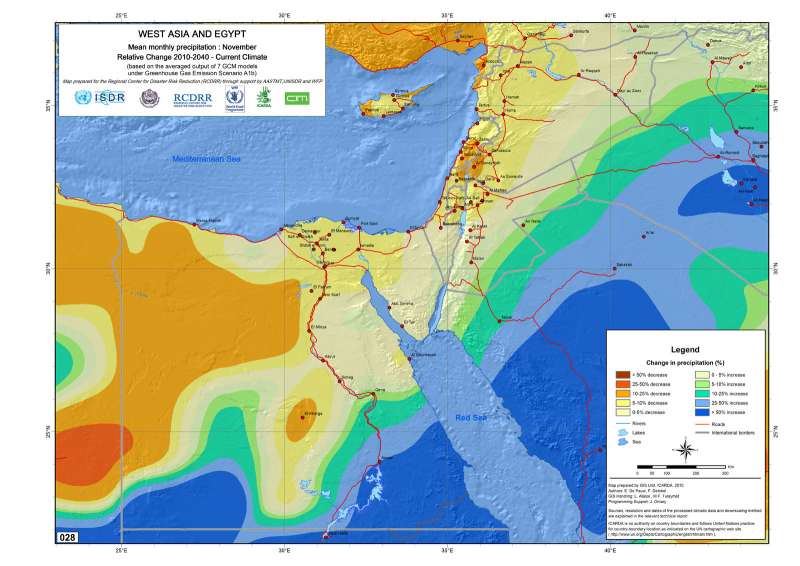
West Asia and Egypt. Relative precipitation change 2010-2040/current climate: November
West Asia and Egypt. Relative precipitation change 2010-2040/current climate: November (based on the averaged output of 7 GCM models under Greenhouse Gas Emission Scenario A1b)
Metadataclose[x]
West Asia and Egypt. Relative precipitation change 2010-2040/current climate: November
Baseline data to assist development agencies in planning for adaptation strategies to climate change
West Asia and Egypt. Relative precipitation change 2010-2040/current climate: November (based on the averaged output of 7 GCM models under Greenhouse Gas Emission Scenario A1b)
International Center for Agricultural Research in the Dry Areas (ICARDA)
2010
climate change, downscaling, GCM, precipitation, emission scenario A1b
West Asia, Egypt, Israel, Jordan, Lebanon, Occupied Palestinian Territories, Syria
15.329752
46.013085
44.627669
16.736002
D_WGS_1984
WGS_1984
6378137.000000
298.257224

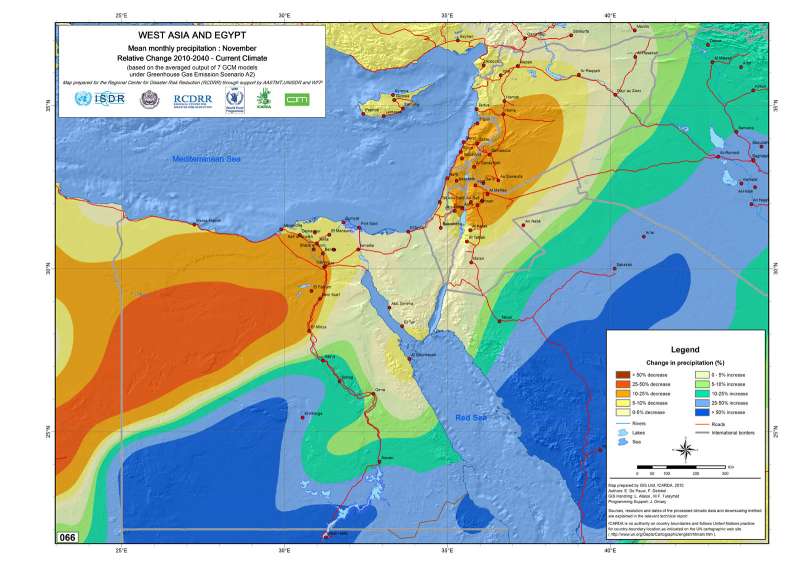
West Asia and Egypt. Relative precipitation change 2010-2040/current climate: November
West Asia and Egypt. Relative precipitation change 2010-2040/current climate: November (based on the averaged output of 7 GCM models under Greenhouse Gas Emission Scenario A2)
Metadataclose[x]
West Asia and Egypt. Relative precipitation change 2010-2040/current climate: November
Baseline data to assist development agencies in planning for adaptation strategies to climate change
West Asia and Egypt. Relative precipitation change 2010-2040/current climate: November (based on the averaged output of 7 GCM models under Greenhouse Gas Emission Scenario A2)
International Center for Agricultural Research in the Dry Areas (ICARDA)
2010
climate change, downscaling, GCM, precipitation, emission scenario A2
West Asia, Egypt, Israel, Jordan, Lebanon, Occupied Palestinian Territories, Syria
15.329752
46.013085
44.627669
16.736002
D_WGS_1984
WGS_1984
6378137.000000
298.257224

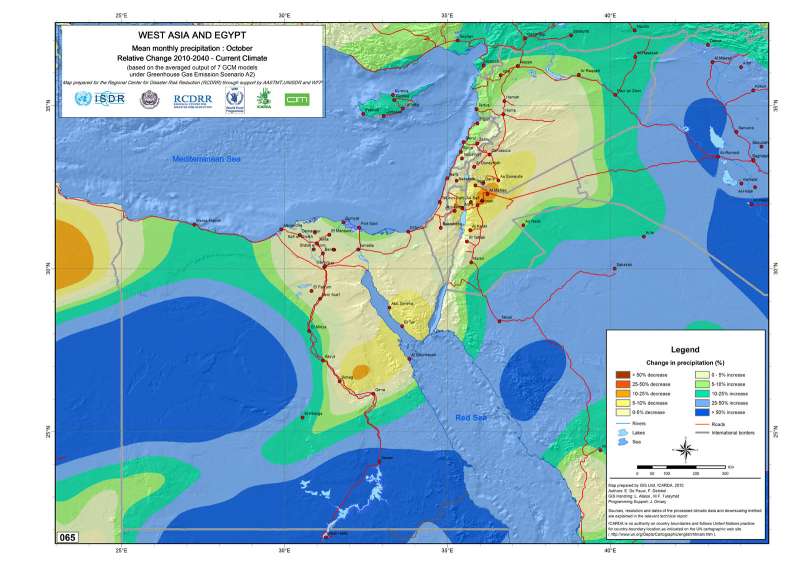
West Asia and Egypt. Relative precipitation change 2010-2040/current climate: October
West Asia and Egypt. Relative precipitation change 2010-2040/current climate: October (based on the averaged output of 7 GCM models under Greenhouse Gas Emission Scenario A2)
Metadataclose[x]
West Asia and Egypt. Relative precipitation change 2010-2040/current climate: October
Baseline data to assist development agencies in planning for adaptation strategies to climate change
West Asia and Egypt. Relative precipitation change 2010-2040/current climate: October (based on the averaged output of 7 GCM models under Greenhouse Gas Emission Scenario A2)
International Center for Agricultural Research in the Dry Areas (ICARDA)
2010
climate change, downscaling, GCM, precipitation, emission scenario A2
West Asia, Egypt, Israel, Jordan, Lebanon, Occupied Palestinian Territories, Syria
15.329752
46.013085
44.627669
16.736002
D_WGS_1984
WGS_1984
6378137.000000
298.257224

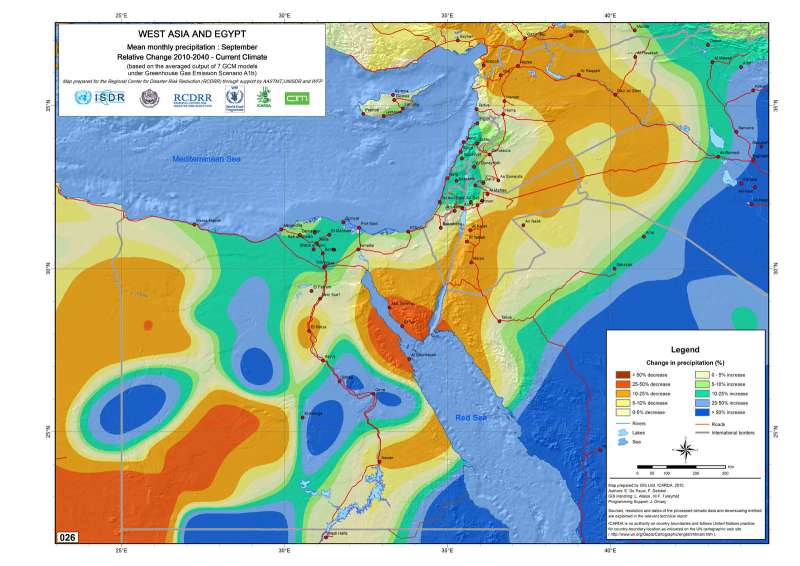
West Asia and Egypt. Relative precipitation change 2010-2040/current climate: September
West Asia and Egypt. Relative precipitation change 2010-2040/current climate: August (based on the averaged output of 7 GCM models under Greenhouse Gas Emission Scenario A1b)
Metadataclose[x]
West Asia and Egypt. Relative precipitation change 2010-2040/current climate: September
Baseline data to assist development agencies in planning for adaptation strategies to climate change
West Asia and Egypt. Relative precipitation change 2010-2040/current climate: August (based on the averaged output of 7 GCM models under Greenhouse Gas Emission Scenario A1b)
International Center for Agricultural Research in the Dry Areas (ICARDA)
2010
climate change, downscaling, GCM, precipitation, emission scenario A1b
West Asia, Egypt, Israel, Jordan, Lebanon, Occupied Palestinian Territories, Syria
15.329752
46.013085
44.627669
16.736002
D_WGS_1984
WGS_1984
6378137.000000
298.257224

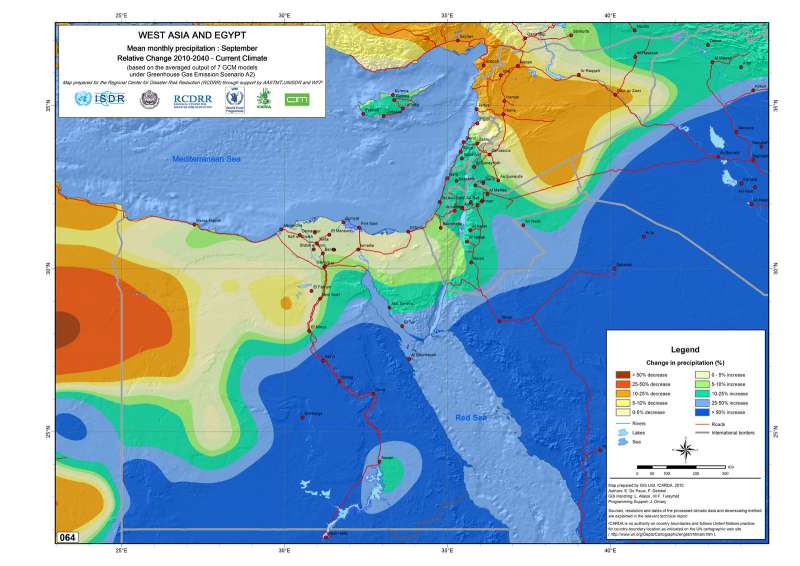
West Asia and Egypt. Relative precipitation change 2010-2040/current climate: September
West Asia and Egypt. Relative precipitation change 2010-2040/current climate: September (based on the averaged output of 7 GCM models under Greenhouse Gas Emission Scenario A2)
Metadataclose[x]
West Asia and Egypt. Relative precipitation change 2010-2040/current climate: September
Baseline data to assist development agencies in planning for adaptation strategies to climate change
West Asia and Egypt. Relative precipitation change 2010-2040/current climate: September (based on the averaged output of 7 GCM models under Greenhouse Gas Emission Scenario A2)
International Center for Agricultural Research in the Dry Areas (ICARDA)
2010
climate change, downscaling, GCM, precipitation, emission scenario A2
West Asia, Egypt, Israel, Jordan, Lebanon, Occupied Palestinian Territories, Syria
15.329752
46.013085
44.627669
16.736002
D_WGS_1984
WGS_1984
6378137.000000
298.257224